ID: MRFR/ICT/1076-CR | February 2019 | Region: Global | 124 Pages
1 Executive Summary
2 Market Introduction
2.1 Definition 18
2.2 Scope Of The Study 18
2.3 List Of Assumptions 19
2.4 Market Structure 19
3 Research Methodology
3.1 Research Process 21
3.2 Secondary Research 21
3.3 Primary Research 22
3.4 Forecast Model 24
4 Market Dynamics
4.1 Introduction 26
4.2 Drivers 27
4.2.1 Growing Adoption By Enterprises With Remote And Multiple Branch Office 27
4.2.2 Demand For Cloud Services, Data Centres, And Server Virtualization 27
4.2.3 Growing Business Needs For Mobility Services 27
4.3 Challenges 27
4.3.1 Lack Of Technical Expertise And Awareness Among Enterprises 27
4.4 Opportunities 28
4.4.1 Increased Adoption Of Private Cloud Computing Service 28
4.4.2 Telecom Operator Innovations In Service Offering 28
4.5 Value Chain Analysis 29
4.5.1 Infrastructure/Component Vendor 29
4.5.2 Service Providers 30
4.5.3 Standardization Body 30
4.5.4 Solution Testing Service Provider 30
4.5.5 End-Users 30
4.6 Porter’s Five Forces Model 31
4.6.1 Threat Of New Entrants 31
4.6.2 Bargaining Power Of Suppliers 31
4.6.3 Bargaining Power Of End-Users 31
4.6.4 Threat Of Substitutes 31
4.6.5 Intensity Of Rivalry 31
5 Global Software Defined Networking Market, By Organization Size
5.1 Overview 33
5.1.1 Small And Medium Enterprise 33
5.1.2 Large Enterprises 33
6 Global Software Defined Networking Market, By Component
6.1 Overview 35
6.1.1 Hardware Component 35
6.1.2 Services 36
6.1.3 Software 37
7 Global Software Defined Networking Market, By Application
7.1 Overview 39
7.1.1 SD-WAN 39
7.1.2 SD-LAN 39
7.1.3 Security Applications 40
7.1.4 Others 40
8 Global Software Defined Networking Market, By Solution
8.1 Overview 42
8.1.1 Physical Network Infrastructure Solution 42
8.1.2 Network Virtualization & Automation Solution 42
9 Global Software Defined Networking Market, By End-Users
9.1 Overview 44
9.1.1 Retail 44
9.1.2 IT & Telecommunication 44
9.1.3 Healthcare 45
9.1.4 BFSI 45
9.1.5 Industrial 45
9.1.6 Government 45
9.1.7 Others 45
10 Global Software Defined Networking Market, By Region
10.1 Introduction 47
10.2 North America 48
10.2.1 US 54
10.2.2 Canada 56
10.2.3 Mexico 58
10.3 Europe 60
10.3.1 UK 65
10.3.2 Germany 67
10.3.3 France 69
10.3.4 Rest Of Europe 71
10.4 Asia-Pacific 73
10.4.1 China 78
10.4.2 Japan 80
10.4.3 India 82
10.4.4 Rest Of Asia-Pacific 84
10.5 Rest Of The World 87
10.5.1 Middle East & Africa 92
10.5.2 Latin America 94
11 Competitive Landscape
11.1 Competitive Landscape Overview 97
11.2 Competitive Benchmarking 98
12 Company Profiles
12.1 Huawei Technologies Co. Ltd 100
12.1.1 Company Overview 100
12.1.2 Financial Overview 100
12.1.3 Services/Solutions Offered 101
12.1.4 Key Development 101
12.1.5 SWOT Analysis 101
12.1.6 Key Strategy 101
12.2 Hewlett Packard Enterprise Company 102
12.2.1 Company Overview 102
12.2.2 Financial Overview 102
12.2.3 Products/Services/Solutions Offered 103
12.2.4 Key Developments 103
12.2.5 SWOT Analysis 103
12.2.6 Key Strategy 103
12.3 Cisco Systems, Inc. 104
12.3.1 Company Overview 104
12.3.2 Financial Overview 104
12.3.3 Services/Solutions Offered 105
12.3.4 Key Developments 105
12.3.5 SWOT Analysis 105
12.3.6 Key Strategy 105
12.4 NEC Corporation 106
12.4.1 Company Overview 106
12.4.2 Financial Overview 106
12.4.3 Products/Solutions Offered 107
12.4.4 Key Developments 107
12.4.5 SWOT Analysis 107
12.4.6 Key Strategy 107
12.5 Juniper Networks Inc. 108
12.5.1 Company Overview 108
12.5.2 Financial Overview 108
12.5.3 Products/Solutions Offered 109
12.5.4 Key Developments 109
12.5.5 SWOT Analysis 109
12.5.6 Key Strategy 109
12.6 IBM Corporation 110
12.6.1 Company Overview 110
12.6.2 Financial Performance 110
12.6.3 Services/Solutions Offered 111
12.6.4 Key Developments 111
12.6.5 SWOT Analysis 111
12.6.6 Key Strategy 111
12.7 Intel Corporation 112
12.7.1 Company Overview 112
12.7.2 Financial Performance 113
12.7.3 Product/Technology Offered 113
12.7.4 SWOT Analysis 114
12.7.5 Key Strategies 114
12.8 Ciena Corporation 115
12.8.1 Company Overview 115
12.8.2 Financial Performance 115
12.8.3 Product/Technology Offered 116
12.8.4 Key Developments 116
12.8.5 SWOT Analysis 116
12.9 Pluribus Networks Inc. 117
12.9.1 Company Overview 117
12.9.2 Product/Solution Offered 117
12.9.3 Key Developments 118
12.10 Pica8 Inc 119
12.10.1 Company Overview 119
12.10.2 Product/Solutions Offered 119
12.10.3 Key Developments 119
12.11 Big Switch Networks Inc 120
12.11.1 Company Overview 120
12.11.2 Products/Solutions/Services/Technology Offered 120
12.11.3 Key Developments 121
12.11.4 Key Strategies 121
12.12 Brocade Communications Systems Inc. 122
12.12.1 Company Overview 122
12.12.2 Financial Performance 122
12.12.3 Product/Technology Offered 123
12.12.4 Key Developments 123
12.12.5 SWOT Analysis 123
12.12.6 Key Strategies 123
12.13 Ulak Communications 123
13 List Of Tables
TABLE 1 MARKET SYNOPSIS 16
TABLE 2 LIST OF ASSUMPTIONS 19
TABLE 3 GLOBAL SOFTWARE DEFINED NETWORKING MARKET, BY ORGANIZATION SIZE, 2020-2027 (USD MILLION) 33
TABLE 4 GLOBAL SOFTWARE DEFINED NETWORKING MARKET, BY COMPONENT, 2020-2027 (USD MILLION) 35
TABLE 5 GLOBAL SOFTWARE DEFINED NETWORKING MARKET, BY HARDWARE, 2020-2027 (USD MILLION) 35
TABLE 6 GLOBAL SOFTWARE DEFINED NETWORKING MARKET, BY SERVICE, 2020-2027 (USD MILLION) 36
TABLE 7 GLOBAL SOFTWARE DEFINED NETWORKING MARKET, BY SOFTWARE, 2020-2027 (USD MILLION) 37
TABLE 8 GLOBAL SOFTWARE DEFINED NETWORKING MARKET, BY APPLICATION, 2020-2027 (USD MILLION) 39
TABLE 9 GLOBAL SOFTWARE DEFINED NETWORKING MARKET, BY SOLUTION, 2020-2027 (USD MILLION) 42
TABLE 10 GLOBAL SOFTWARE DEFINED NETWORKING MARKET, BY END-USER, 2020-2027 (USD MILLION) 44
TABLE 11 GLOBAL SOFTWARE DEFINED NETWORKING MARKET, BY REGION, 2020-2027 (USD MILLION) 47
TABLE 12 NORTH AMERICA: SOFTWARE DEFINED NETWORKING MARKET, BY COUNTRY, 2020-2027 (USD MILLION) 48
TABLE 13 NORTH AMERICA: SOFTWARE DEFINED NETWORKING MARKET, BY ORGANIZATION SIZE, 2020-2027 (USD MILLION) 49
TABLE 14 NORTH AMERICA: SOFTWARE DEFINED NETWORKING MARKET, BY COMPONENT, 2020-2027 (USD MILLION) 49
TABLE 15 NORTH AMERICA: SOFTWARE DEFINED NETWORKING MARKET, BY HARDWARE, 2020-2027 (USD MILLION) 50
TABLE 16 NORTH AMERICA: SOFTWARE DEFINED NETWORKING MARKET, BY SERVICE, 2020-2027 (USD MILLION) 50
TABLE 17 NORTH AMERICA: SOFTWARE DEFINED NETWORKING MARKET, BY SOFTWARE, 2020-2027 (USD MILLION) 50
TABLE 18 NORTH AMERICA: SOFTWARE DEFINED NETWORKING MARKET, BY APPLICATION, 2020-2027 (USD MILLION) 51
TABLE 19 NORTH AMERICA: SOFTWARE DEFINED NETWORKING MARKET, BY SOLUTION, 2020-2027 (USD MILLION) 52
TABLE 20 NORTH AMERICA: SOFTWARE DEFINED NETWORKING MARKET, BY END-USER, 2020-2027 (USD MILLION) 53
TABLE 21 US: SOFTWARE DEFINED NETWORKING MARKET, BY ORGANIZATION SIZE, 2020-2027 (USD MILLION) 54
TABLE 22 US: SOFTWARE DEFINED NETWORKING MARKET, BY COMPONENT, 2020-2027 (USD MILLION) 54
TABLE 23 US: SOFTWARE DEFINED NETWORKING MARKET, BY HARDWARE, 2020-2027 (USD MILLION) 54
TABLE 24 US: SOFTWARE DEFINED NETWORKING MARKET, BY SERVICE, 2020-2027 (USD MILLION) 54
TABLE 25 US: SOFTWARE DEFINED NETWORKING MARKET, BY SOFTWARE, 2020-2027 (USD MILLION) 54
TABLE 26 US: SOFTWARE DEFINED NETWORKING MARKET, BY APPLICATION, 2020-2027 (USD MILLION) 55
TABLE 27 US: SOFTWARE DEFINED NETWORKING MARKET, BY SOLUTION, 2020-2027 (USD MILLION) 55
TABLE 28 US: SOFTWARE DEFINED NETWORKING MARKET, BY END-USER, 2020-2027 (USD MILLION) 55
TABLE 29 CANADA: SOFTWARE DEFINED NETWORKING MARKET, BY ORGANIZATION SIZE, 2020-2027 (USD MILLION) 56
TABLE 30 CANADA: SOFTWARE DEFINED NETWORKING MARKET, BY COMPONENT, 2020-2027 (USD MILLION) 56
TABLE 31 CANADA: SOFTWARE DEFINED NETWORKING MARKET, BY HARDWARE, 2020-2027 (USD MILLION) 56
TABLE 32 CANADA: SOFTWARE DEFINED NETWORKING MARKET, BY SERVICE, 2020-2027 (USD MILLION) 56
TABLE 33 CANADA: SOFTWARE DEFINED NETWORKING MARKET, BY SOFTWARE, 2020-2027 (USD MILLION) 56
TABLE 34 CANADA: SOFTWARE DEFINED NETWORKING MARKET, BY APPLICATION, 2020-2027 (USD MILLION) 57
TABLE 35 CANADA: SOFTWARE DEFINED NETWORKING MARKET, BY SOLUTION, 2020-2027 (USD MILLION) 57
TABLE 36 CANADA: SOFTWARE DEFINED NETWORKING MARKET, BY END-USER, 2020-2027 (USD MILLION) 57
TABLE 37 MEXICO: SOFTWARE DEFINED NETWORKING MARKET, BY ORGANIZATION SIZE, 2020-2027 (USD MILLION) 58
TABLE 38 MEXICO: SOFTWARE DEFINED NETWORKING MARKET, BY COMPONENT, 2020-2027 (USD MILLION) 58
TABLE 39 MEXICO: SOFTWARE DEFINED NETWORKING MARKET, BY HARDWARE, 2020-2027 (USD MILLION) 58
TABLE 40 MEXICO: SOFTWARE DEFINED NETWORKING MARKET, BY SERVICE, 2020-2027 (USD MILLION) 58
TABLE 41 MEXICO: SOFTWARE DEFINED NETWORKING MARKET, BY SOFTWARE, 2020-2027 (USD MILLION) 58
TABLE 42 MEXICO: SOFTWARE DEFINED NETWORKING MARKET, BY APPLICATION, 2020-2027 (USD MILLION) 59
TABLE 43 MEXICO: SOFTWARE DEFINED NETWORKING MARKET, BY SOLUTION, 2020-2027 (USD MILLION) 59
TABLE 44 MEXICO: SOFTWARE DEFINED NETWORKING MARKET, BY END-USER, 2020-2027 (USD MILLION) 59
TABLE 45 EUROPE: SOFTWARE DEFINED NETWORKING MARKET, BY COUNTRY, 2020-2027 (USD MILLION) 60
TABLE 46 EUROPE: SOFTWARE DEFINED NETWORKING MARKET, BY ORGANIZATION SIZE, 2020-2027 (USD MILLION) 61
TABLE 47 EUROPE: SOFTWARE DEFINED NETWORKING MARKET, BY COMPONENT, 2020-2027 (USD MILLION) 61
TABLE 48 EUROPE: SOFTWARE DEFINED NETWORKING MARKET, BY HARDWARE, 2020-2027 (USD MILLION) 61
TABLE 49 EUROPE: SOFTWARE DEFINED NETWORKING MARKET, BY SERVICE, 2020-2027 (USD MILLION) 62
TABLE 50 EUROPE: SOFTWARE DEFINED NETWORKING MARKET, BY SOFTWARE, 2020-2027 (USD MILLION) 62
TABLE 51 EUROPE: SOFTWARE DEFINED NETWORKING MARKET, BY APPLICATION, 2020-2027 (USD MILLION) 62
TABLE 52 EUROPE: SOFTWARE DEFINED NETWORKING MARKET, BY SOLUTION, 2020-2027 (USD MILLION) 63
TABLE 53 EUROPE: SOFTWARE DEFINED NETWORKING MARKET, BY END-USER, 2020-2027 (USD MILLION) 64
TABLE 54 UK: SOFTWARE DEFINED NETWORKING MARKET, BY ORGANIZATION SIZE, 2020-2027 (USD MILLION) 65
TABLE 55 UK: SOFTWARE DEFINED NETWORKING MARKET, BY COMPONENT, 2020-2027 (USD MILLION) 65
TABLE 56 UK: SOFTWARE DEFINED NETWORKING MARKET, BY HARDWARE, 2020-2027 (USD MILLION) 65
TABLE 57 UK: SOFTWARE DEFINED NETWORKING MARKET, BY SERVICE, 2020-2027 (USD MILLION) 65
TABLE 58 UK: SOFTWARE DEFINED NETWORKING MARKET, BY SOFTWARE, 2020-2027 (USD MILLION) 65
TABLE 59 UK: SOFTWARE DEFINED NETWORKING MARKET, BY APPLICATION, 2020-2027 (USD MILLION) 66
TABLE 60 UK: SOFTWARE DEFINED NETWORKING MARKET, BY SOLUTION, 2020-2027 (USD MILLION) 66
TABLE 61 UK: SOFTWARE DEFINED NETWORKING MARKET, BY END-USER, 2020-2027 (USD MILLION) 66
TABLE 62 GERMANY: SOFTWARE DEFINED NETWORKING MARKET, BY ORGANIZATION SIZE, 2020-2027 (USD MILLION) 67
TABLE 63 GERMANY: SOFTWARE DEFINED NETWORKING MARKET, BY COMPONENT, 2020-2027 (USD MILLION) 67
TABLE 64 GERMANY: SOFTWARE DEFINED NETWORKING MARKET, BY HARDWARE, 2020-2027 (USD MILLION) 67
TABLE 65 GERMANY: SOFTWARE DEFINED NETWORKING MARKET, BY SERVICE, 2020-2027 (USD MILLION) 67
TABLE 66 GERMANY: SOFTWARE DEFINED NETWORKING MARKET, BY SOFTWARE, 2020-2027 (USD MILLION) 67
TABLE 67 GERMANY: SOFTWARE DEFINED NETWORKING MARKET, BY APPLICATION, 2020-2027 (USD MILLION) 68
TABLE 68 GERMANY: SOFTWARE DEFINED NETWORKING MARKET, BY SOLUTION, 2020-2027 (USD MILLION) 68
TABLE 69 GERMANY: SOFTWARE DEFINED NETWORKING MARKET, BY END-USER, 2020-2027 (USD MILLION) 68
TABLE 70 FRANCE: SOFTWARE DEFINED NETWORKING MARKET, BY ORGANIZATION SIZE, 2020-2027 (USD MILLION) 69
TABLE 71 FRANCE: SOFTWARE DEFINED NETWORKING MARKET, BY COMPONENT, 2020-2027 (USD MILLION) 69
TABLE 72 FRANCE: SOFTWARE DEFINED NETWORKING MARKET, BY HARDWARE, 2020-2027 (USD MILLION) 69
TABLE 73 FRANCE: SOFTWARE DEFINED NETWORKING MARKET, BY SERVICE, 2020-2027 (USD MILLION) 69
TABLE 74 FRANCE: SOFTWARE DEFINED NETWORKING MARKET, BY SOFTWARE, 2020-2027 (USD MILLION) 69
TABLE 75 FRANCE: SOFTWARE DEFINED NETWORKING MARKET, BY APPLICATION, 2020-2027 (USD MILLION) 70
TABLE 76 FRANCE: SOFTWARE DEFINED NETWORKING MARKET, BY SOLUTION, 2020-2027 (USD MILLION) 70
TABLE 77 FRANCE: SOFTWARE DEFINED NETWORKING MARKET, BY END-USER, 2020-2027 (USD MILLION) 70
TABLE 78 REST OF EUROPE: SOFTWARE DEFINED NETWORKING MARKET, BY ORGANIZATION SIZE, 2020-2027 (USD MILLION) 71
TABLE 79 REST OF EUROPE: SOFTWARE DEFINED NETWORKING MARKET, BY COMPONENT, 2020-2027 (USD MILLION) 71
TABLE 80 REST OF EUROPE: SOFTWARE DEFINED NETWORKING MARKET, BY HARDWARE, 2020-2027 (USD MILLION) 71
TABLE 81 REST OF EUROPE: SOFTWARE DEFINED NETWORKING MARKET, BY SERVICE, 2020-2027 (USD MILLION) 71
TABLE 82 REST OF EUROPE: SOFTWARE DEFINED NETWORKING MARKET, BY SOFTWARE, 2020-2027 (USD MILLION) 71
TABLE 83 REST OF EUROPE: SOFTWARE DEFINED NETWORKING MARKET, BY APPLICATION, 2020-2027 (USD MILLION) 72
TABLE 84 REST OF EUROPE: SOFTWARE DEFINED NETWORKING MARKET, BY SOLUTION, 2020-2027 (USD MILLION) 72
TABLE 85 REST OF EUROPE: SOFTWARE DEFINED NETWORKING MARKET, BY END-USER, 2020-2027 (USD MILLION) 72
TABLE 86 ASIA-PACIFIC: SOFTWARE DEFINED NETWORKING MARKET, BY COUNTRY, 2020-2027 (USD MILLION) 73
TABLE 87 ASIA-PACIFIC: SOFTWARE DEFINED NETWORKING MARKET, BY ORGANIZATION SIZE, 2020-2027 (USD MILLION) 74
TABLE 88 ASIA-PACIFIC: SOFTWARE DEFINED NETWORKING MARKET, BY COMPONENT, 2020-2027 (USD MILLION) 74
TABLE 89 ASIA-PACIFIC: SOFTWARE DEFINED NETWORKING MARKET, BY HARDWARE, 2020-2027 (USD MILLION) 74
TABLE 90 ASIA-PACIFIC: SOFTWARE DEFINED NETWORKING MARKET, BY SERVICE, 2020-2027 (USD MILLION) 75
TABLE 91 ASIA-PACIFIC: SOFTWARE DEFINED NETWORKING MARKET, BY SOFTWARE, 2020-2027 (USD MILLION) 75
TABLE 92 ASIA-PACIFIC: SOFTWARE DEFINED NETWORKING MARKET, BY APPLICATION, 2020-2027 (USD MILLION) 75
TABLE 93 ASIA-PACIFIC: SOFTWARE DEFINED NETWORKING MARKET, BY SOLUTION, 2020-2027 (USD MILLION) 76
TABLE 94 ASIA-PACIFIC: SOFTWARE DEFINED NETWORKING MARKET, BY END-USER, 2020-2027 (USD MILLION) 77
TABLE 95 CHINA: SOFTWARE DEFINED NETWORKING MARKET, BY ORGANIZATION SIZE, 2020-2027 (USD MILLION) 78
TABLE 96 CHINA: SOFTWARE DEFINED NETWORKING MARKET, BY COMPONENT, 2020-2027 (USD MILLION) 78
TABLE 97 CHINA: SOFTWARE DEFINED NETWORKING MARKET, BY HARDWARE, 2020-2027 (USD MILLION) 78
TABLE 98 CHINA: SOFTWARE DEFINED NETWORKING MARKET, BY SERVICE, 2020-2027 (USD MILLION) 78
TABLE 99 CHINA: SOFTWARE DEFINED NETWORKING MARKET, BY SOFTWARE, 2020-2027 (USD MILLION) 78
TABLE 100 CHINA: SOFTWARE DEFINED NETWORKING MARKET, BY APPLICATION, 2020-2027 (USD MILLION) 79
TABLE 101 CHINA: SOFTWARE DEFINED NETWORKING MARKET, BY SOLUTION, 2020-2027 (USD MILLION) 79
TABLE 102 CHINA: SOFTWARE DEFINED NETWORKING MARKET, BY END-USER, 2020-2027 (USD MILLION) 79
TABLE 103 JAPAN: SOFTWARE DEFINED NETWORKING MARKET, BY ORGANIZATION SIZE, 2020-2027 (USD MILLION) 80
TABLE 104 JAPAN: SOFTWARE DEFINED NETWORKING MARKET, BY COMPONENT, 2020-2027 (USD MILLION) 80
TABLE 105 JAPAN: SOFTWARE DEFINED NETWORKING MARKET, BY HARDWARE, 2020-2027 (USD MILLION) 80
TABLE 106 JAPAN: SOFTWARE DEFINED NETWORKING MARKET, BY SERVICE, 2020-2027 (USD MILLION) 80
TABLE 107 JAPAN: SOFTWARE DEFINED NETWORKING MARKET, BY SOFTWARE, 2020-2027 (USD MILLION) 80
TABLE 108 JAPAN: SOFTWARE DEFINED NETWORKING MARKET, BY APPLICATION, 2020-2027 (USD MILLION) 81
TABLE 109 JAPAN: SOFTWARE DEFINED NETWORKING MARKET, BY SOLUTION, 2020-2027 (USD MILLION) 81
TABLE 110 JAPAN: SOFTWARE DEFINED NETWORKING MARKET, BY END-USER, 2020-2027 (USD MILLION) 81
TABLE 111 INDIA: SOFTWARE DEFINED NETWORKING MARKET, BY ORGANIZATION SIZE, 2020-2027 (USD MILLION) 82
TABLE 112 INDIA: SOFTWARE DEFINED NETWORKING MARKET, BY COMPONENT, 2020-2027 (USD MILLION) 82
TABLE 113 INDIA: SOFTWARE DEFINED NETWORKING MARKET, BY HARDWARE, 2020-2027 (USD MILLION) 82
TABLE 114 INDIA: SOFTWARE DEFINED NETWORKING MARKET, BY SERVICE, 2020-2027 (USD MILLION) 82
TABLE 115 INDIA: SOFTWARE DEFINED NETWORKING MARKET, BY SOFTWARE, 2020-2027 (USD MILLION) 82
TABLE 116 INDIA: SOFTWARE DEFINED NETWORKING MARKET, BY APPLICATION, 2020-2027 (USD MILLION) 83
TABLE 117 INDIA: SOFTWARE DEFINED NETWORKING MARKET, BY SOLUTION, 2020-2027 (USD MILLION) 83
TABLE 118 INDIA: SOFTWARE DEFINED NETWORKING MARKET, BY END-USER, 2020-2027 (USD MILLION) 83
TABLE 119 REST OF ASIA-PACIFIC: SOFTWARE DEFINED NETWORKING MARKET, BY ORGANIZATION SIZE, 2020-2027 (USD MILLION) 84
TABLE 120 REST OF ASIA-PACIFIC: SOFTWARE DEFINED NETWORKING MARKET, BY COMPONENT, 2020-2027 (USD MILLION) 84
TABLE 121 REST OF ASIA-PACIFIC: SOFTWARE DEFINED NETWORKING MARKET, BY HARDWARE, 2020-2027 (USD MILLION) 84
TABLE 122 REST OF ASIA-PACIFIC: SOFTWARE DEFINED NETWORKING MARKET, BY SERVICE, 2020-2027 (USD MILLION) 84
TABLE 123 REST OF ASIA-PACIFIC: SOFTWARE DEFINED NETWORKING MARKET, BY SOFTWARE, 2020-2027 (USD MILLION) 85
TABLE 124 REST OF ASIA-PACIFIC: SOFTWARE DEFINED NETWORKING MARKET, BY APPLICATION, 2020-2027 (USD MILLION) 85
TABLE 125 REST OF ASIA-PACIFIC: SOFTWARE DEFINED NETWORKING MARKET, BY SOLUTION, 2020-2027 (USD MILLION) 85
TABLE 126 REST OF ASIA-PACIFIC: SOFTWARE DEFINED NETWORKING MARKET, BY END-USER, 2020-2027 (USD MILLION) 85
TABLE 127 REST OF THE WORLD: SOFTWARE DEFINED NETWORKING MARKET, BY COUNTRY, 2020-2027 (USD MILLION) 87
TABLE 128 REST OF THE WORLD: SOFTWARE DEFINED NETWORKING MARKET, BY ORGANIZATION SIZE, 2020-2027 (USD MILLION) 87
TABLE 129 REST OF THE WORLD: SOFTWARE DEFINED NETWORKING MARKET, BY COMPONENT, 2020-2027 (USD MILLION) 88
TABLE 130 REST OF THE WORLD: SOFTWARE DEFINED NETWORKING MARKET, BY HARDWARE, 2020-2027 (USD MILLION) 88
TABLE 131 REST OF THE WORLD: SOFTWARE DEFINED NETWORKING MARKET, BY SERVICE, 2020-2027 (USD MILLION) 88
TABLE 132 REST OF THE WORLD: SOFTWARE DEFINED NETWORKING MARKET, BY SOFTWARE, 2020-2027 (USD MILLION) 89
TABLE 133 REST OF THE WORLD: SOFTWARE DEFINED NETWORKING MARKET, BY APPLICATION, 2020-2027 (USD MILLION) 89
TABLE 134 REST OF THE WORLD: SOFTWARE DEFINED NETWORKING MARKET, BY SOLUTION, 2020-2027 (USD MILLION) 90
TABLE 135 REST OF THE WORLD: SOFTWARE DEFINED NETWORKING MARKET, BY END-USER, 2020-2027 (USD MILLION) 91
TABLE 136 MIDDLE EAST & AFRICA: SOFTWARE DEFINED NETWORKING MARKET, BY ORGANIZATION SIZE, 2020-2027 (USD MILLION) 92
TABLE 137 MIDDLE EAST & AFRICA: SOFTWARE DEFINED NETWORKING MARKET, BY COMPONENT, 2020-2027 (USD MILLION) 92
TABLE 138 MIDDLE EAST & AFRICA: SOFTWARE DEFINED NETWORKING MARKET, BY HARDWARE, 2020-2027 (USD MILLION) 92
TABLE 139 MIDDLE EAST & AFRICA: SOFTWARE DEFINED NETWORKING MARKET, BY SERVICE, 2020-2027 (USD MILLION) 92
TABLE 140 MIDDLE EAST & AFRICA: SOFTWARE DEFINED NETWORKING MARKET, BY SOFTWARE, 2020-2027 (USD MILLION) 93
TABLE 141 MIDDLE EAST & AFRICA: SOFTWARE DEFINED NETWORKING MARKET, BY APPLICATION, 2020-2027 (USD MILLION) 93
TABLE 142 MIDDLE EAST & AFRICA: SOFTWARE DEFINED NETWORKING MARKET, BY SOLUTION, 2020-2027 (USD MILLION) 93
TABLE 143 MIDDLE EAST & AFRICA: SOFTWARE DEFINED NETWORKING MARKET, BY END-USER, 2020-2027 (USD MILLION) 93
TABLE 144 LATIN AMERICA: SOFTWARE DEFINED NETWORKING MARKET, BY ORGANIZATION SIZE, 2020-2027 (USD MILLION) 94
TABLE 145 LATIN AMERICA: SOFTWARE DEFINED NETWORKING MARKET, BY COMPONENT, 2020-2027 (USD MILLION) 94
TABLE 146 LATIN AMERICA: SOFTWARE DEFINED NETWORKING MARKET, BY HARDWARE, 2020-2027 (USD MILLION) 94
TABLE 147 LATIN AMERICA: SOFTWARE DEFINED NETWORKING MARKET, BY SERVICE, 2020-2027 (USD MILLION) 94
TABLE 148 LATIN AMERICA: SOFTWARE DEFINED NETWORKING MARKET, BY SOFTWARE, 2020-2027 (USD MILLION) 94
TABLE 149 LATIN AMERICA: SOFTWARE DEFINED NETWORKING MARKET, BY APPLICATION, 2020-2027 (USD MILLION) 95
TABLE 150 LATIN AMERICA: SOFTWARE DEFINED NETWORKING MARKET, BY SOLUTION, 2020-2027 (USD MILLION) 95
TABLE 151 LATIN AMERICA: SOFTWARE DEFINED NETWORKING MARKET, BY END-USER, 2020-2027 (USD MILLION) 95
14 List Of Figures
FIGURE 1 GLOBAL SOFTWARE DEFINED NETWORKING MARKET: MARKET STRUCTURE 19
FIGURE 2 TOP DOWN & BOTTOM UP APPROACH 23
FIGURE 3 DRIVERS, OPPORTUNITIES AND RESTRAINTS ANALYSIS OF GLOBAL SOFTWARE DEFINED NETWORKING MARKET 26
FIGURE 4 VALUE CHAIN: SOFTWARE DEFINED NETWORKING MARKET 29
FIGURE 5 PORTER'S FIVE FORCES ANALYSIS OF THE GLOBAL SOFTWARE DEFINED NETWORKING MARKET 31
FIGURE 6 GLOBAL SOFTWARE DEFINED NETWORKING MARKET, BY ORGANIZATION SIZE, 2020 VS 2027 (USD MILLION) 33
FIGURE 7 GLOBAL SOFTWARE DEFINED NETWORKING MARKET, BY COMPONENT, 2020 VS 2027 (USD MILLION) 35
FIGURE 8 GLOBAL SOFTWARE DEFINED NETWORKING MARKET, BY APPLICATION, 2020 VS 2027 (USD MILLION) 39
FIGURE 9 GLOBAL SOFTWARE DEFINED NETWORKING MARKET, BY SOLUTION, 2020 VS 2027 (USD MILLION) 42
FIGURE 10 GLOBAL SOFTWARE DEFINED NETWORKING MARKET, BY END-USER, 2020 VS 2027 (USD MILLION) 44
FIGURE 11 GLOBAL SOFTWARE DEFINED NETWORKING MARKET, BY REGION, 2020 VS 2027 (USD MILLION) 47
FIGURE 12 NORTH AMERICA: SOFTWARE DEFINED NETWORKING MARKET SHARE, BY COUNTRY, 2020 (% SHARE) 48
FIGURE 13 NORTH AMERICA: SOFTWARE DEFINED NETWORKING MARKET, BY ORGANIZATION SIZE, 2020 VS 2027 (USD MILLION) 48
FIGURE 14 NORTH AMERICA: SOFTWARE DEFINED NETWORKING MARKET, BY COMPONENT, 2020 VS 2027 (USD MILLION) 49
FIGURE 15 NORTH AMERICA: SOFTWARE DEFINED NETWORKING MARKET, BY APPLICATION, 2020 VS 2027 (USD MILLION) 51
FIGURE 16 NORTH AMERICA: SOFTWARE DEFINED NETWORKING MARKET, BY SOLUTION, 2020 VS 2027 (USD MILLION) 51
FIGURE 17 NORTH AMERICA: SOFTWARE DEFINED NETWORKING MARKET, BY END-USER, 2020 VS 2027 (USD MILLION) 52
FIGURE 18 EUROPE: SOFTWARE DEFINED NETWORKING MARKET SHARE, BY COUNTRY, 2020 (% SHARE) 60
FIGURE 19 EUROPE: SOFTWARE DEFINED NETWORKING MARKET, BY ORGANIZATION SIZE, 2020 VS 2027 (USD MILLION) 60
FIGURE 20 EUROPE: SOFTWARE DEFINED NETWORKING MARKET, BY COMPONENT, 2020 VS 2027 (USD MILLION) 61
FIGURE 21 EUROPE: SOFTWARE DEFINED NETWORKING MARKET, BY APPLICATION, 2020 VS 2027 (USD MILLION) 62
FIGURE 22 EUROPE: SOFTWARE DEFINED NETWORKING MARKET, BY SOLUTION, 2020 VS 2027 (USD MILLION) 63
FIGURE 23 EUROPE: SOFTWARE DEFINED NETWORKING MARKET, BY END-USER, 2020 VS 2027 (USD MILLION) 63
FIGURE 24 ASIA-PACIFIC: SOFTWARE DEFINED NETWORKING MARKET SHARE, BY COUNTRY, 2020 (% SHARE) 73
FIGURE 25 ASIA-PACIFIC: SOFTWARE DEFINED NETWORKING MARKET, BY ORGANIZATION SIZE, 2020 VS 2027 (USD MILLION) 73
FIGURE 26 ASIA-PACIFIC: SOFTWARE DEFINED NETWORKING MARKET, BY COMPONENT, 2020 VS 2027 (USD MILLION) 74
FIGURE 27 ASIA-PACIFIC: SOFTWARE DEFINED NETWORKING MARKET, BY APPLICATION, 2020 VS 2027 (USD MILLION) 75
FIGURE 28 ASIA-PACIFIC: SOFTWARE DEFINED NETWORKING MARKET, BY SOLUTION, 2020 VS 2027 (USD MILLION) 76
FIGURE 29 ASIA-PACIFIC: SOFTWARE DEFINED NETWORKING MARKET, BY END-USER, 2020 VS 2027 (USD MILLION) 76
FIGURE 30 REST OF THE WORLD: SOFTWARE DEFINED NETWORKING MARKET SHARE, BY COUNTRY, 2020 (% SHARE) 87
FIGURE 31 REST OF THE WORLD: SOFTWARE DEFINED NETWORKING MARKET, BY ORGANIZATION SIZE, 2020 VS 2027 (USD MILLION) 87
FIGURE 32 REST OF THE WORLD: SOFTWARE DEFINED NETWORKING MARKET, BY COMPONENT, 2020 VS 2027 (USD MILLION) 88
FIGURE 33 REST OF THE WORLD: SOFTWARE DEFINED NETWORKING MARKET, BY APPLICATION, 2020 VS 2027 (USD MILLION) 89
FIGURE 34 REST OF THE WORLD: SOFTWARE DEFINED NETWORKING MARKET, BY SOLUTION, 2020 VS 2027 (USD MILLION) 90
FIGURE 35 REST OF THE WORLD: SOFTWARE DEFINED NETWORKING MARKET, BY END-USER, 2020 VS 2027 (USD MILLION) 90
FIGURE 36 BENCHMARKING OF MAJOR COMPETITORS 98
$37.71 billion
21.24%%
North America
2030
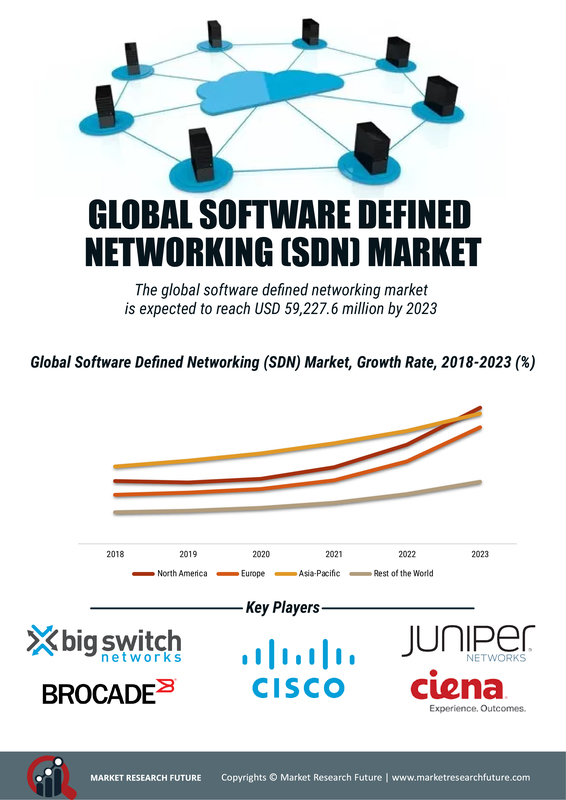
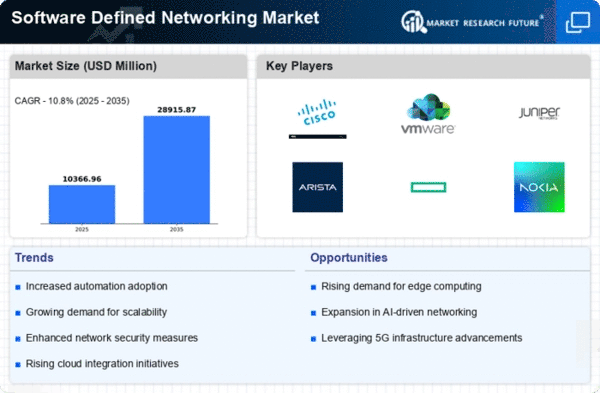
Market Research Future (MRFR) expects the Software-Defined Networking Market expected to reach 37.71 billion and to display a CAGR of 21.24% from 2018 to 2030 (forecast period). The high rate of adoption in the Software Defined Networking Market Share, is because of the rapid digitization in the global regions. The global market is now dominated by North America for the time being. On the other hand, APAC is expected witness a massive growth in the forecast period.
The report comprises of the market dynamics such as the market drivers, opportunities and challenges. Also, it discusses the segmentation overview and detailed regional analysis. Some recent developments and competitive landscape has also been highlighted along with prominent key players of the market. It also analyses the capability, growth potential of the market, the impact of covid-19 pandemic and how the market will retrieve the growth.
Impact of Covid-19 Analysis:
The pandemic, Covid-19 has changed and affected the industries all across the globe. The impact of the outbreak can be seen in market and behaviour of the customer as well. The society and the economy has also been affected by the pandemic. The spread of the virus has forced governments to opt for shut down for a major period of time. Therefore, many sports and events have become postponed and work-from-home and social distancing have come to the routine. This scenario is forcing the businesses to find out new technologies that can help them sell on the internet.
Market Dynamics:
Drivers:
In the past decades, the network infrastructures have been seeing a rapid rate of increase in size and complexity. Software defined market solutions provide flexibility to the traffic management to improve the network efficiency of the operator. Therefore, the CSPs all across the world have been investing in the Software Defined Networking technology for having end-to-end network, better control and more efficient service management.
Opportunities:
The opportunity for the SND market is the huge amount of increase in the number of IoT devices. In recent times, the number of IoT devices are in billions. And, these IoT devices need proper connectivity. Therefore, it make a huge increase in the Software Defined Networking Market Opportunities.
Challenges:
In the Software Defined Networking market, the primary challenge is to transform the traditional infrastructure and existing technology efficiently. Although there are several vendors who are interested in collaborating with many other SDN solution providers, but this challenge has proven beneficial for some existing traditional technology vendors.
Segmentation Overview:
The Software Defined Networking Industry is segmented into the following parts-
By Components:
Based on components, the market is segmented into-
By SDN Types:
Based on SDN types, the market is segmented into-
By End-users:
Based on End-users, the market is segmented into-
By Professional Services:
Based on Professional services, the market is segmented into-
By Organization Size:
Based on Organization size, the market is segmented into-
By Enterprise Verticals:
Based on Enterprise verticals, the market is segmented into-
By Regions:
Based on Regions, the market is segmented into-
Software-Defined Networking (SDN) Market Regional Analysis:
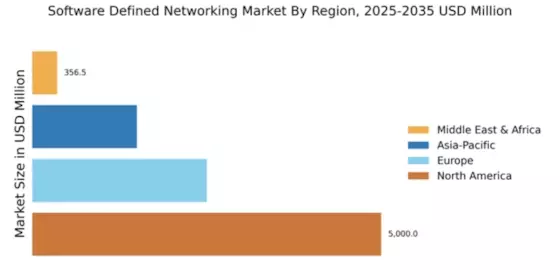
The regional market has five main regional segments. The analysis of regional market provides a deeper and better understanding of the global market of Software Defined Networking market. Among all the five regions of the global Software Defined Networking (SDN) Market, North America is expected to exhibit the highest growth in the forecast period. This market has a high growth potential. The growth of this region is being driven by the fast and rapid adoption technologies, such as network functions virtualisation, cloud computing, mobility services, and BYOD (bring your own device). The North American region has always seen a high rate of industrialisation which has been always the growth market of technologies especially in US and Canada. This region has several key players of the market. Therefore, the investments and high rate of opening up to new opportunities have always given a boost to the Software Defined Networking Market Size of the region.
On the other hand, APAC region has been going through a huge digitisation especially countries like China and India. Therefore, it is expected that the Asia Pacific region will go through a huge market growth in the forecast period.
Competitive Landscape:
With so many players like Cisco, Dell, HPE, VM Ware, Nokia and so on in the market vying for the top spot the competition level is going to be very tricky. As per the Software Defined Networking Market Analysis they must try and overcome the primary challenge of transforming the traditional infrastructure and existing technology in a seamless manner. Players who would be able to do it will go up the ladder and will play the defining role for the market.
Recent Developments:
There have been various developments which have very encouraging for the SDN Market to grow in a huge extent.
For example, with Fortinet rolling out new edition of its FortiOS operating system which is capable enough to give the customers the capacity of managing security capabilities across the cloud resources and SD-WAN environments. This is a one of the defining developments which can easily pave the way for a new horizon for the market.
Additionally, the partnership of Cisco with IBM Network Services in order to assist their customers to get the advantage from IBM’s complete life-cycle services for SDN alongside the Cisco ACI based technology is also one of the notable developments for sure. This was conceived for empowering customers and letting them experience the full benefits of SDN, including software-based programming, automated control of networks, network function virtualization and so on.
Moreover, the launching of the Agile Controller 3.0 by Huawei is also one worth mentioning. It is based on open source ONOS controller which is managed by the Linux Foundation. Interesting fact is that this is also attuned with the OpenDaylight Project (ODL) controller via APIs. The primary reason why Huawei launched this product is to strengthen its product portfolio in SD-WAN and IoT market.
There is more news which can be really encouraging for the Software Defined Networking Market Trends.
Report Overview:
Frequently Asked Questions (FAQ) :
The software-defined networking market is set to hit USD 59 billion by 2023, with CAGR of 21.24% over the review period.
The software-defined networking market segmentation is conducted based on organization size, component, application, solution, and end-user.
North American region is set to dominate the market over the assessment period.
The primary challenge for the Software Defined Networking market is to transform the traditional infrastructure and existing technology proficiently.
Competitive Landscape Overview
The global software defined networking market is characterized by the presence of many global, regional, and local vendors. The market is highly competitive with all the players competing to gain market share. Intense competition, rapid advances in technology, and frequent changes in government policies are the key factors that limit market growth. The vendors compete based on quality of service, pricing, and reliability. It is crucial for the vendors to provide advanced technology and value-added services for software defined networking vendors to survive and succeed in an intensely competitive market environment.
The growth of the market vendors is dependent on the market conditions, government support, and industry development. Thus, the vendors should focus on geographic expansion and advancement in digital services. Cisco Systems Inc., Juniper Networks Inc., NEC Corporation, Brocade Communications Systems Inc., Intel Corporation, Big Switch Networks, Hewlett Packard Enterprise Company, Huawei Technologies Co. Ltd, Pica8 Inc., Ciena Corporation, Pluribus Networks Inc., and IBM Corporation, Ulak Communications are the major companies in the market that compete in terms of services offered, pricing of IPN devices, and availability of components from suppliers. These companies primarily focus on the development of switches, network infrastructure, and controllers. Although the global players are dominating the market, regional players with small market shares also have a strong presence. The global players are expected to strengthen their presence worldwide through organic and inorganic growth during the forecast period.
The vendors with better technical and financial resources can develop innovative products that render the ones by their competitors obsolete and non-competitive even before they are launched, or costs are recovered. Therefore, vendors must develop new technologies and stay in touch with emerging technologies that could affect the continuing competitiveness of their product lines in the market.
Cisco systems Inc. designs, manufactures, and sells internet protocol-based networking services and products to the IT and telecommunication organizations. The company serves various industries such as energy, education, healthcare, retail, and hospitality. In their software-defined networking portfolio the company provides various solutions such as Application-Centric Infrastructure (ACI), DNA Center, SD-Access, SD-WAN, and SD-Branch. The company operates in the Americas, EMEA, and APAC regions.
Big Switch Networks is a provider of an open software-defined networking (SDN) technology. The company has strategic partnerships with HPE, Edgecore, and Dell EMC. It provides products, services, solutions, and various technologies related to SDN to the end-users. Big Switch Networks partnered with Microsoft Azure to provide integrated solution for its new Azure Virtual Network Terminal Access Point (TAP). Big Monitoring Fabric- public cloud are integrated with Azure to provide secure, scalable, and simple solutions to monitor workload. The company mainly focuses on product management, product marketing, technical marketing, a technological partnership, and acquisitions.
Brocade Communication Systems Inc. specializes in network solution. On 17 November 2017, Broadcom acquired Brocade Communications systems Inc. In software defined networking, the company provides various products such as Brocade SDN controller, Brocade flow optimizer, Brocade flow manager, and Brocade VNF manager. The company’s acquisition and investment strategy focus on expansion and evolution of shared storage network-based analytics, security, data management, and IP networking.
NEC Corporation (NEC) is a global provider of information technology services and products. It offers IT and network solutions to business enterprises, communications services providers, and government agencies and is one of the biggest PC vendors in Japan. It also provides services for IT, network systems, electronic devices and others. NEC is focused on R&D to drive technological development. The company aims to become a complete solution provider of integrated communications and advance hardware components.
Juniper Networks, Inc. engages in the sale of products and services, design, and development, for high-performance networks. The company operates in various business segments including switching, routing, and security products which are designed to provide high performance, flexibility, and low total ownership cost. Juniper Network focuses on delivering highly reliable, scalable, cost-effective, and secure network for increasing network’s speed, efficiency, and value through automation.