Virtual Dressing Room Market Segmentation
Virtual Dressing Room Market By Component (USD Billion, 2025-2035)
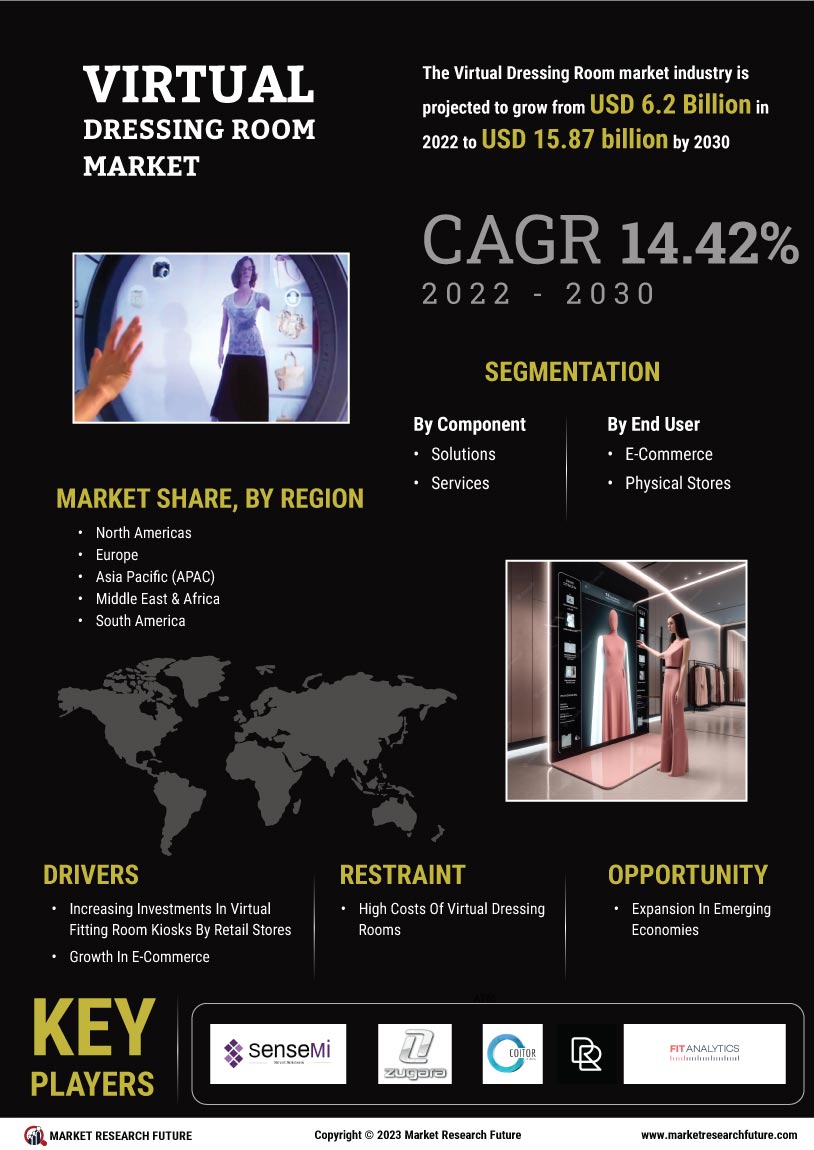
- Solutions
- Virtual Dressing Room Markets
- Posterior Fusion
- Others
Virtual Dressing Room Market By End Users (USD Billion, 2025-2035)
- E-commerce
- Physical Stores
- Others