Vertigo Treatment Market (2026 - 2035)

ID: MRFR/HC/6986-HCR 100 Pages Vikita Thakur Last Updated: September 15, 2026
Vertigo Treatment Market Research Report: Size, Share, Trend Analysis By Types (BPPV, Labyrinthitis, Vestibular Neuronitis, Meniere’s disease), By Treatment (Anticholinergics, Antihistamines, Benzodiazepines, Others) and By End-User (Hospital, Clinics) - Growth Outlook & Industry Forecast 2025 To 2035
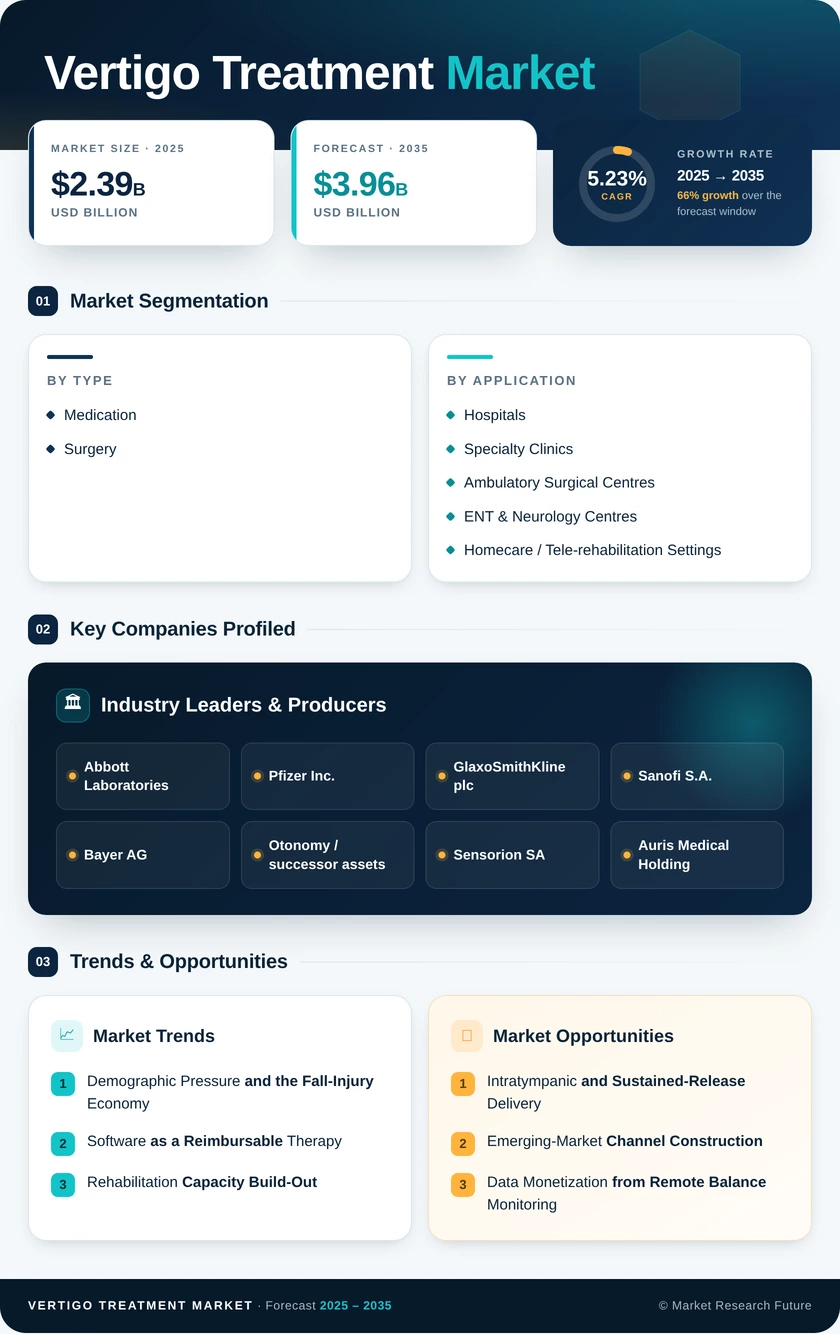
Vertigo Treatment Market
Market Size
Forecast Period2026-2035
CAGR (2026-2035)5.23%
2025 Market SizeUSD 2.39 Billion
2035 Market SizeUSD 3.96 Billion
Key Players
Abbott Laboratories
Pfizer Inc.
GlaxoSmithKline plc
Sanofi S.A.
Bayer AG
Otonomy / successor assets
Opportunities
  • Intratympanic and Sustained-Release Delivery
  • Emerging-Market Channel Construction
  • Data Monetization from Remote Balance Monitoring
  1. 1 Market Summary |
    1. 1.1 Study Assumptions & Market Definition |
    2. 1.2 Scope of the Study |
    3. 1.3 Research Methodology
  2. 2 Key Report Takeaways |
    1. 2.1 By Type |
    2. 2.2 By Treatment Type |
    3. 2.3 By End User |
    4. 2.4 By Geography
  3. 3 Market Size & Forecast (2021–2035) |
    1. 3.1 Historical Market Size (2021–2025) |
    2. 3.2 Forecast Market Size (2026–2035) |
    3. 3.3 Year-over-Year Growth Analysis
  4. 4 Driver Impact Analysis |
    1. 4.1 Demographic Pressure and the Fall-Injury Economy |
    2. 4.2 Software as a Reimbursable Therapy |
    3. 4.3 Rehabilitation Capacity Build-Out |
    4. 4.4 Diagnostic Latency Compression
  5. 5 Restraints Impact Analysis |
    1. 5.1 Price Erosion in the Pharmacological Core |
    2. 5.2 The Primary Care Diagnostic Gap |
    3. 5.3 Coverage Fragmentation for Digital Interventions
  6. 6 Opportunity Analysis |
    1. 6.1 Intratympanic and Sustained-Release Delivery |
    2. 6.2 Emerging-Market Channel Construction |
    3. 6.3 Data Monetization from Remote Balance Monitoring |
    4. 6.4 Ambulatory Migration of Surgical Procedures |
    5. 6.5 Combination Protocols Pairing Drugs with Rehabilitation |
    6. 6.6 Industry Value Chain Analysis |
    7. 6.7 Porter's Five Forces Analysis
  7. 7 Regional Market Share & Country-Level Analysis |
    1. 7.1 North America | |
      1. 7.1.1 US | |
      2. 7.1.2 Canada | |
      3. 7.1.3 Mexico |
    2. 7.2 Europe | |
      1. 7.2.1 Germany | |
      2. 7.2.2 UK | |
      3. 7.2.3 France | |
      4. 7.2.4 Italy | |
      5. 7.2.5 Spain | |
      6. 7.2.6 Nordic Countries | |
      7. 7.2.7 Russia | |
      8. 7.2.8 Rest of Europe |
    3. 7.3 Asia-Pacific | |
      1. 7.3.1 China | |
      2. 7.3.2 India | |
      3. 7.3.3 Japan | |
      4. 7.3.4 South Korea | |
      5. 7.3.5 ASEAN | |
      6. 7.3.6 Rest of Asia-Pacific |
    4. 7.4 South America | |
      1. 7.4.1 Brazil | |
      2. 7.4.2 Argentina | |
      3. 7.4.3 Rest of South America |
    5. 7.5 Middle East & Africa | |
      1. 7.5.1 Saudi Arabia | |
      2. 7.5.2 UAE | |
      3. 7.5.3 South Africa | |
      4. 7.5.4 Egypt | |
      5. 7.5.5 Rest of MEA
  8. 8 Future Outlook (2026–2035) |
    1. 8.1 Algorithmic Triage at the Front Door |
    2. 8.2 Platform Economics in Rehabilitation |
    3. 8.3 Biologics Displacing Symptomatic Suppression |
    4. 8.4 Value-Based Contracting
  9. 9 Market Segmentation Analysis |
    1. 9.1 By Type | |
      1. 9.1.1 Peripheral Vertigo | |
      2. 9.1.2 Central Vertigo |
    2. 9.2 By Treatment Type | |
      1. 9.2.1 Medication | |
      2. 9.2.2 Surgery |
    3. 9.3 By End User | |
      1. 9.3.1 Hospitals | |
      2. 9.3.2 Specialty Clinics | |
      3. 9.3.3 Ambulatory Surgical Centres | |
      4. 9.3.4 ENT & Neurology Centres | |
      5. 9.3.5 Homecare / Tele-rehabilitation Settings
  10. 10 Competitive Landscape |
    1. 10.1 Market Concentration Analysis (2026) |
    2. 10.2 Competitive Benchmarking Matrix |
    3. 10.3 Company Profiles
  11. 11 Recent News & Developments
  12. 12 Report Scope & Methodology
  13. 13 Detailed Sources & Citations
  14. 14 Frequently Asked Questions
  15. 15 LIST OF TABLES |
  16. TABLE 1 Global Vertigo Treatment Market Size & Forecast, by Revenue (USD Billion), 2021–2035 |
  17. TABLE 2 Global Vertigo Treatment Market — Year-over-Year Growth Analysis, 2021–2035 |
  18. TABLE 3 Driver Impact Analysis Matrix, 2026–2035 |
  19. TABLE 4 Restraint Impact Analysis Matrix, 2026–2035 |
  20. TABLE 5 Global Market Size, by Region, 2021–2035 (USD Billion) |
  21. TABLE 6 North America Market Size, by Country, 2021–2035 (USD Billion) |
  22. TABLE 7 Europe Market Size, by Country, 2021–2035 (USD Billion) |
  23. TABLE 8 Asia-Pacific Market Size, by Country, 2021–2035 (USD Billion) |
  24. TABLE 9 South America Market Size, by Country, 2021–2035 (USD Billion) |
  25. TABLE 10 Middle East & Africa Market Size, by Country, 2021–2035 (USD Billion) |
  26. TABLE 11 Global Market Size, by Type, 2021–2035 (USD Billion) |
  27. TABLE 12 Global Market Size, by Treatment Type, 2021–2035 (USD Billion) |
  28. TABLE 13 Global Market Size, by End User, 2021–2035 (USD Billion) |
  29. TABLE 14 North America Market Size, by Type and Treatment Type, 2021–2035 (USD Billion) |
  30. TABLE 15 Europe Market Size, by Type and End User, 2021–2035 (USD Billion) |
  31. TABLE 16 Asia-Pacific Market Size, by Treatment Type and End User, 2021–2035 (USD Billion) |
  32. TABLE 17 South America Market Size, by Segment Dimension, 2021–2035 (USD Billion) |
  33. TABLE 18 Middle East & Africa Market Size, by Segment Dimension, 2021–2035 (USD Billion) |
  34. TABLE 19 Competitive Benchmarking Matrix, 2026 |
  35. TABLE 20 Company Profiles — Key Players |
  36. TABLE 21 Recent Developments & Strategic Announcements, 2023–2025 |
  37. TABLE 22 Report Scope & Methodology Summary |
  38. TABLE 23 Detailed Sources & Citations Index
  39. 16 LIST OF FIGURES |
  40. FIGURE 1 Market Dynamics — Drivers, Restraints and Opportunities Overview |
  41. FIGURE 2 Industry Value Chain Analysis |
  42. FIGURE 3 Porter's Five Forces Analysis |
  43. FIGURE 4 Global Market Size Trend, 2021–2035 (USD Billion) |
  44. FIGURE 5 Year-over-Year Growth Curve, 2022–2035 (%) |
  45. FIGURE 6 Market Share by Type, 2025 vs 2035 (%) |
  46. FIGURE 7 Market Share by Treatment Type, 2025 vs 2035 (%) |
  47. FIGURE 8 Market Share by End User, 2025 (%) |
  48. FIGURE 9 Regional Revenue Share Distribution, 2025 (%) |
  49. FIGURE 10 Regional CAGR Comparison, 2026–2035 (%) |
  50. FIGURE 11 Country-Level Contribution Heat Map, 2025 |
  51. FIGURE 12 Competitive Landscape — Estimated Revenue Share Ranges, 2026 |
  52. FIGURE 13 Strategic Positioning Matrix — Innovation vs Scale |
  53. FIGURE 14 Pipeline and Regulatory Milestone Timeline, 2023–2035

Segmentation Quick Reference

DimensionSub-SegmentsDominant SegmentFastest Growing Segment
By TypePeripheral Vertigo; Central VertigoPeripheral VertigoCentral Vertigo
By Treatment TypeMedication; SurgeryMedicationSurgery
By End UserHospitals; Specialty Clinics; Ambulatory Surgical Centres; ENT & Neurology Centres; Homecare/Tele-rehabilitation SettingsHospitalsAmbulatory Surgical Centres
By GeographyNorth America; Europe; Asia-Pacific; Middle East and Africa; South AmericaNorth AmericaAsia-Pacific


Market Segmentation Overview

By Type

Sub-SegmentKey Trend
Peripheral VertigoProtocol-driven repositioning maneuvers shifting care to lower-cost settings
Central VertigoRising stroke survivorship creating long-horizon management demand


Peripheral cases supply the volume base while central cases supply the growth premium. Suppliers structured around high-throughput, low-unit-cost peripheral care face different economics from those pursuing complex central presentations, and few compete credibly in both.

By Treatment Type

Sub-SegmentKey Trend
MedicationSustained generic price erosion offsetting steady volume expansion
SurgeryMigration of procedures into ambulatory settings improving procedure economics


Value and volume are diverging in this dimension. Pharmacological demand keeps rising while its revenue contribution flattens, pushing strategic attention toward interventional and device-adjacent revenue pools.

By End User

Sub-SegmentKey Trend
HospitalsAcute dizziness triage protocols sustaining first-contact volume
Specialty ClinicsConcentration of vestibular expertise driving referral capture
Ambulatory Surgical CentresCost arbitrage accelerating scheduled-procedure migration
ENT & Neurology CentresComplex differential diagnosis anchoring premium service pricing
Homecare / Tele-rehabilitation SettingsRemote adherence monitoring extending treatment duration


End-user mix is the most commercially consequential dimension here. Hospitals still see the patient first, but the treatment increasingly happens somewhere cheaper — and channel strategy has to follow the procedure, not the diagnosis.

By Region

Sub-SegmentKey Trend
North AmericaReimbursement codes enabling billable rehabilitation pathways
EuropeStatutory coverage supporting service-led rather than drug-led growth
Asia-PacificHospital capacity expansion converting latent demand into treated cases
Middle East and AfricaSpecialty centre construction concentrated in Gulf states
South AmericaPublic referral routing shaping therapeutic mix toward central agents


Prevalence is broadly flat worldwide; access is not. Geographic strategy therefore turns on reimbursement maturity and specialist density rather than on epidemiology, which is why the growth ranking looks nothing like the population ranking.




Download PDF ×

We do not share your information with anyone. However, we may send you emails based on your report interest from time to time. You may contact us at any time to opt-out.