ID: MRFR/MED/4280-HCR | February 2021 | Region: Global | 95 pages
Market Scenario
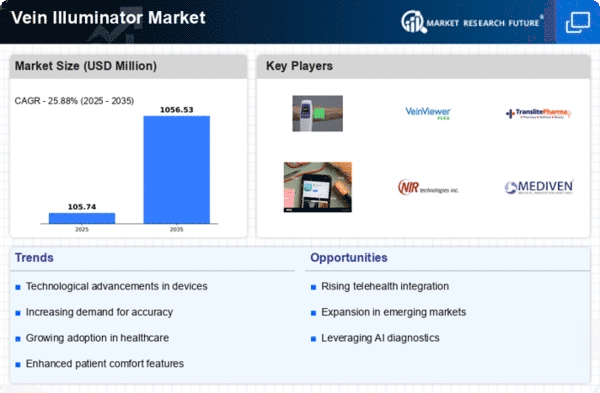
Vein Illuminator Market is expected to register 28.6% CAGR during the forecast period of 2019 to 2025 and held a market value of USD 60.6 Million in 2018.
Vein finder or vein illuminator is a device intended to locate subcutaneous veins using a variety of techniques such as infrared light. Vein illuminators use principles of optical physics such as differential light reflection, refraction, and absorption by tissues to produces a distinct image of the patient’s vein structure. Vein illuminator provides a vivid vein map, which helps increase success rates of invasive treatments, including injections.
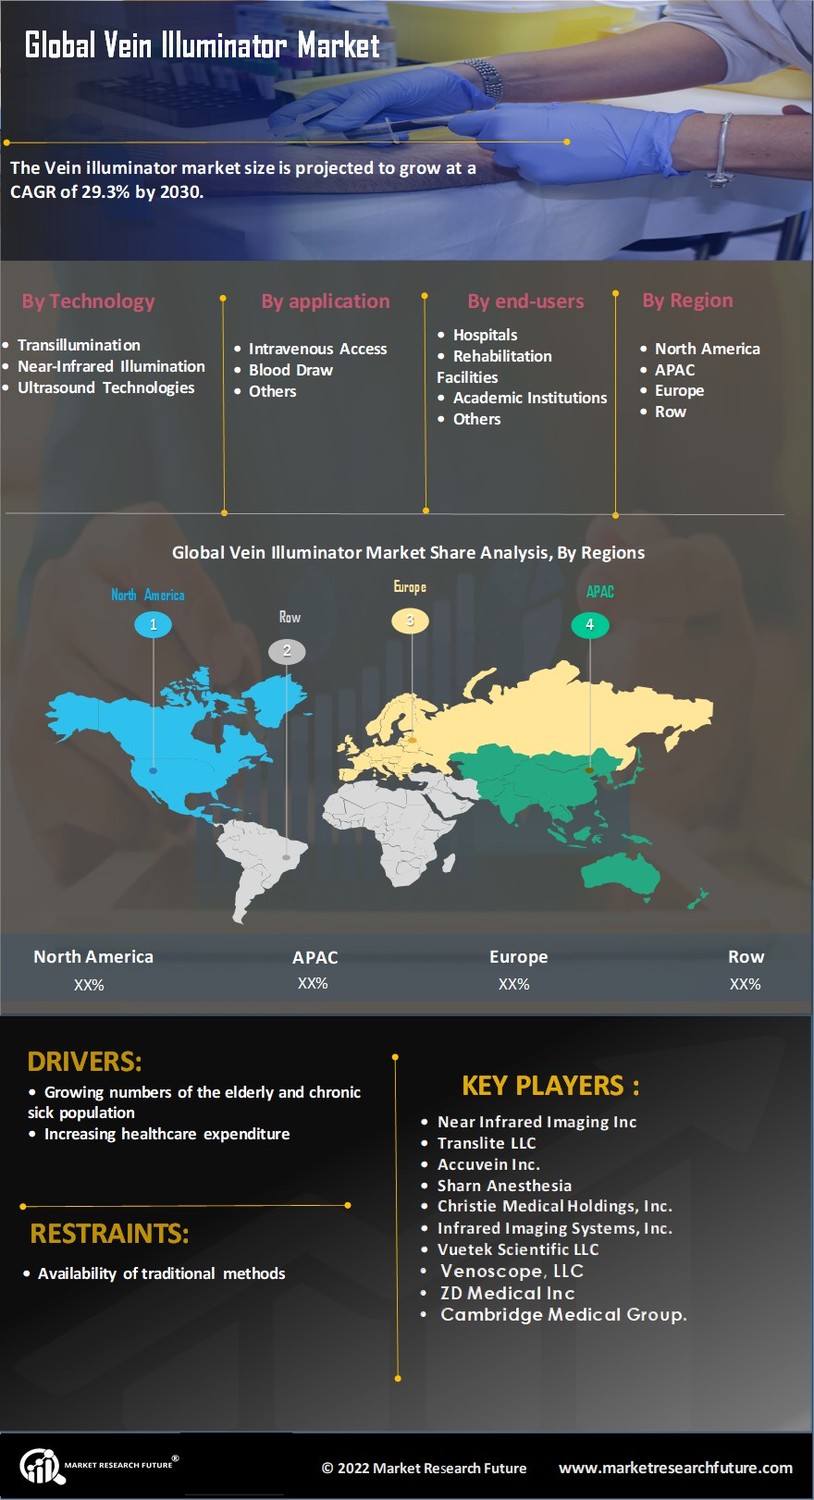
The global vein illuminator market is driven by factors such as growing numbers of the elderly and chronic sick population and increasing healthcare expenditure. Additionally, the increasing usage of vein illuminator in healthcare settings is anticipated to fuel market growth. For instance, according to the Office for National Statistics in 2017, approximately 18% and 2.4% of the total population in the UK was aged over 65 years and 85 years, respectively. On the other hand, the availability of traditional methods is projected to hamper the growth of the market during the assessment period.
Moreover, major companies in the market are involved in strategic acquisitions, collaborations, and mergers to sustain their position in the market.
Segmentation
The Global Vein Illuminator Market has been segmented based on technology, application, end-user, and region.
The global vein illuminator market, based on technology, has been segmented into transillumination, near-infrared illumination, and ultrasound technologies. The transillumination segment is expected to hold a major share in the market due to the rising adoption of these types of devices.
The global vein illuminator market, based on application, has been segmented into intravenous access, blood draw, and others.
The global vein illuminator market, based on end-user, has been bifurcated into hospitals, rehabilitation facilities, academic institutions, and others.
The market has been divided, by region, into the Americas, Europe, Asia-Pacific, and the Middle East & Africa. The vein illuminator market in the Americas has further been branched into North America and Latin America, with the North American market divided into the US and Canada. The European vein illuminator market has been sub-divided into Western Europe and Eastern Europe. Western Europe has further been classified into Germany, France, the UK, Italy, Spain, and the rest of Western Europe. The vein illuminator market in Asia-Pacific has been segmented into Japan, China, India, South Korea, Australia, and the rest of Asia-Pacific. The vein illuminator market in the Middle East & Africa has been divided into the Middle East and Africa.
Key Players
The Key Players operating in the Global Vein Illuminator Market are Near Infrared Imaging Inc, Translite LLC, Accuvein Inc., Sharn Anesthesia, Christie Medical Holdings, Inc., Infrared Imaging Systems, Inc., Vuetek Scientific LLC, Venoscope, LLC, ZD Medical Inc, and Cambridge Medical Group.
Regional Market Summary
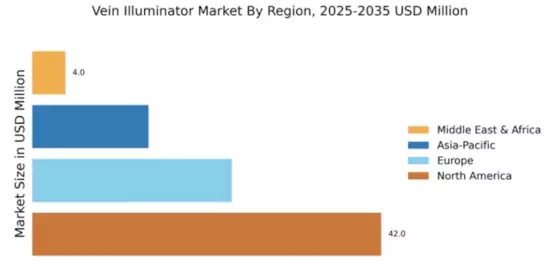
Global Vein Illuminator Market Share, by Region, 2018 (%)
Source: World Health Organization (WHO)
The vein illuminator market in the Americas is expected to dominate the vein illuminator market due to the rising geriatric population and the presence of major established players in the region. Moreover, developed healthcare infrastructure in the US is expected to drive the market growth.
The vein illuminator market in Europe showed a considerable amount of growth. This can be attributed to the presence of a well-established healthcare system, an increase in chronic diseases, and the involvement of key companies.
The vein illuminator market in Asia-Pacific is projected to have a steady growth rate during the forecast period owing to the increasing pool of chronic patient population and increasing government initiatives for healthcare reforms.
The vein illuminator market in the Middle East & Africa is projected to account for the least share of the market due to the low per capita disposable income in the region.
Global Vein Illuminator Market, by Technology
Global Vein Illuminator Market, by Application
Global Vein Illuminator Market, by End User
Global Vein Illuminator Market, by Region
Intended Audience
Table of Contents
1. REPORT PROLOGUE
2. MARKET INTRODUCTION
2.1. Definition
2.2. Scope of the Study
2.2.1. Research Objective
2.2.2. Assumptions
2.2.3. Limitations
3. RESEARCH METHODOLOGY
3.1. Overview
3.2. Primary Research
3.3. Secondary Research
3.4. Market Size Estimation
4. MARKET DYNAMICS
4.1. Overview
4.2. Drivers
4.3. Restraints
4.4. Opportunities
5. MARKET FACTOR ANALYSIS
5.1. Porter’s Five Forces Analysis
5.1.1. Bargaining Power of Suppliers
5.1.2. Bargaining Power of Buyers
5.1.3. Threat of New Entrants
5.1.4. Threat of Substitutes
5.1.5. Intensity of Rivalry
5.2. Value Chain Analysis
6. GLOBAL VEIN ILLUMINATOR MARKET, BY TECHNOLOGY
6.1. Overview
6.2. Transillumination
Market Estimates & Forecast, by Region, 2019–2025
Market Estimates & Forecast, by Country, 2019–2025
6.3. Near Infrared Illumination
Market Estimates & Forecast, by Region, 2019–2025
Market Estimates & Forecast, by Country, 2019–2025
6.4. Ultrasound Technologies
Market Estimates & Forecast, by Region, 2019–2025
Market Estimates & Forecast, by Country, 2019–2025
7. GLOBAL VEIN ILLUMINATOR MARKET, BY APPLICATION
7.1. Overview
7.2. Intravenous Access
Market Estimates & Forecast, by Region, 2019–2025
Market Estimates & Forecast, by Country, 2019–2025
7.3. Blood Draw
Market Estimates & Forecast, by Region, 2019–2025
Market Estimates & Forecast, by Country, 2019–2025
7.4. Others
Market Estimates & Forecast, by Region, 2019–2025
Market Estimates & Forecast, by Country, 2019–2025
8. GLOBAL VEIN ILLUMINATOR MARKET, BY END USER
8.1. Overview
8.2. Hospitals
Market Estimates & Forecast, by Region, 2019–2025
Market Estimates & Forecast, by Country, 2019–2025
8.3. Rehabilitation Facilities
Market Estimates & Forecast, by Region, 2019–2025
Market Estimates & Forecast, by Country, 2019–2025
8.4. Academic Institutions
Market Estimates & Forecast, by Region, 2019–2025
Market Estimates & Forecast, by Country, 2019–2025
8.5. Others
Market Estimates & Forecast, by Region, 2019–2025
Market Estimates & Forecast, by Country, 2019–2025
9. GLOBAL VEIN ILLUMINATOR MARKET, BY REGION
9.1. Overview
9.2. Americas
9.2.1. North America
9.2.1.1. US
9.2.1.2. Canada
9.2.2. Latin America
9.3. Europe
9.3.1. Western Europe
9.3.1.1. Germany
9.3.1.2. France
9.3.1.3. Italy
9.3.1.4. Spain
9.3.1.5. UK
9.3.1.6. Rest of Western Europe
9.3.2. Eastern Europe
9.4. Asia-Pacific
9.4.1. Japan
9.4.2. China
9.4.3. India
9.4.4. Australia
9.4.5. South Korea
9.4.6. Rest of Asia-Pacific
9.5. Middle East & Africa
9.5.1. Middle East
9.5.2. Africa
10. COMPANY LANDSCAPE
10.1.1. Overview
10.1.2. Competitive Analysis
11. COMPANY PROFILE
11.1. Near Infrared Imaging Inc.
11.1.1. Overview
11.1.2. Product Overview
11.1.3. Financial Overview
11.1.4. Key Developments
11.1.5. SWOT Analysis
11.1.6. Key Strategies
11.2. Translite LLC
11.2.1. Overview
11.2.2. Product Overview
11.2.3. Financial Overview
11.2.4. Key Developments
11.2.5. SWOT Analysis
11.2.6. Key Strategies
11.3. Accuvein Inc.
11.3.1. Overview
11.3.2. Product Overview
11.3.3. Financial Overview
11.3.4. Key Developments
11.3.5. SWOT Analysis
11.3.6. Key Strategies
11.4. Sharn Anesthesia
11.4.1. Overview
11.4.2. Product Overview
11.4.3. Financial Overview
11.4.4. Key Developments
11.4.5. SWOT Analysis
11.4.6. Key Strategies
11.5. Christie Medical Holdings, Inc
11.5.1. Overview
11.5.2. Product Overview
11.5.3. Financial Overview
11.5.4. Key Developments
11.5.5. SWOT Analysis
11.5.6. Key Strategies
11.6. Infrared Imaging Systems, Inc.
11.6.1. Overview
11.6.2. Product Overview
11.6.3. Financial Overview
11.6.4. Key Developments
11.6.5. SWOT Analysis
11.6.6. Key Strategies
11.7. Vuetek Scientific LLC
11.7.1. Overview
11.7.2. Product Overview
11.7.3. Financial Overview
11.7.4. Key Developments
11.7.5. SWOT Analysis
11.7.6. Key Strategies
11.8. Venoscope, LLC
11.8.1. Overview
11.8.2. Product Overview
11.8.3. Financial Overview
11.8.4. Key Developments
11.8.5. SWOT Analysis
11.8.6. Key Strategies
11.9. ZD Medical Inc.
11.9.1. Overview
11.9.2. Product Overview
11.9.3. Financial Overview
11.9.4. Key Developments
11.9.5. SWOT Analysis
11.9.6. Key Strategies
11.10. Cambridge Medical Group
11.10.1. Overview
11.10.2. Product Overview
11.10.3. Financial Overview
11.10.4. Key Developments
11.10.5. SWOT Analysis
11.10.6. Key Strategies
11.11. Others
12. APPENDIX
12.1. References
12.2. Related Reports
LIST OF TABLES
TABLE 1 GLOBAL VEIN ILLUMINATOR MARKET SYNOPSIS, 2019–2025
TABLE 2 GLOBAL VEIN ILLUMINATOR MARKET ESTIMATES AND FORECAST, 2019–2025 (USD MILLION)
TABLE 3 GLOBAL VEIN ILLUMINATOR MARKET, BY TECHNOLOGY, 2019–2025 (USD MILLION)
TABLE 4 GLOBAL VEIN ILLUMINATOR MARKET, BY APPLICATION, 2019–2025 (USD MILLION)
TABLE 5 GLOBAL VEIN ILLUMINATOR MARKET, BY END USER, 2019–2025 (USD MILLION)
TABLE 6 GLOBAL VEIN ILLUMINATOR MARKET, BY REGION, 2019–2025 (USD MILLION)
TABLE 7 NORTH AMERICA: VEIN ILLUMINATOR MARKET, BY TECHNOLOGY, 2019–2025 (USD MILLION)
TABLE 8 NORTH AMERICA: VEIN ILLUMINATOR MARKET, BY APPLICATION, 2019–2025 (USD MILLION)
TABLE 9 NORTH AMERICA: VEIN ILLUMINATOR MARKET, BY END USER, 2019–2025 (USD MILLION)
TABLE 10 US: VEIN ILLUMINATOR MARKET, BY DRUG CLASS, 2019–2025 (USD MILLION)
TABLE 11 US: VEIN ILLUMINATOR MARKET, BY APPLICATION, 2019–2025 (USD MILLION)
TABLE 12 US: VEIN ILLUMINATOR MARKET, BY END USER, 2019–2025 (USD MILLION)
TABLE 13 CANADA: VEIN ILLUMINATOR MARKET, BY TECHNOLOGY, 2019–2025 (USD MILLION)
TABLE 14 CANADA: VEIN ILLUMINATOR MARKET, BY APPLICATION, 2019–2025 (USD MILLION)
TABLE 15 CANADA: VEIN ILLUMINATOR MARKET, BY END USER, 2019–2025 (USD MILLION)
TABLE 16 LATIN AMERICA: VEIN ILLUMINATOR MARKET, BY DRUG CLASS, 2019–2025 (USD MILLION)
TABLE 17 LATIN AMERICA: VEIN ILLUMINATOR MARKET, BY APPLICATION, 2019–2025 (USD MILLION)
TABLE 18 LATIN AMERICA: VEIN ILLUMINATOR MARKET, BY END USER, 2019–2025 (USD MILLION)
TABLE 19 EUROPE: VEIN ILLUMINATOR MARKET, BY TECHNOLOGY, 2019–2025 (USD MILLION)
TABLE 20 EUROPE: VEIN ILLUMINATOR MARKET, BY APPLICATION, 2019–2025 (USD MILLION)
TABLE 21 EUROPE: VEIN ILLUMINATOR MARKET, BY END USER, 2019–2025 (USD MILLION)
TABLE 22 WESTERN EUROPE: VEIN ILLUMINATOR MARKET, BY TECHNOLOGY, 2019–2025 (USD MILLION)
TABLE 23 WESTERN EUROPE: VEIN ILLUMINATOR MARKET, BY APPLICATION, 2019–2025 (USD MILLION)
TABLE 24 WESTERN EUROPE: VEIN ILLUMINATOR MARKET, BY END USER, 2019–2025 (USD MILLION)
TABLE 25 EASTERN EUROPE: VEIN ILLUMINATOR MARKET, BY TECHNOLOGY, 2019–2025 (USD MILLION)
TABLE 26 EASTERN EUROPE: VEIN ILLUMINATOR MARKET, BY APPLICATION, 2019–2025 (USD MILLION)
TABLE 27 EASTERN EUROPE: VEIN ILLUMINATOR MARKET, BY END USER, 2019–2025 (USD MILLION)
TABLE 28 ASIA-PACIFIC: VEIN ILLUMINATOR MARKET, BY TECHNOLOGY, 2019–2025 (USD MILLION)
TABLE 29 ASIA-PACIFIC: VEIN ILLUMINATOR MARKET, BY APPLICATION, 2019–2025 (USD MILLION)
TABLE 30 ASIA-PACIFIC: VEIN ILLUMINATOR MARKET, BY END USER, 2019–2025 (USD MILLION)
TABLE 31 MIDDLE EAST & AFRICA: VEIN ILLUMINATOR MARKET, BY TECHNOLOGY, 2019–2025 (USD MILLION)
TABLE 32 MIDDLE EAST & AFRICA: VEIN ILLUMINATOR MARKET, BY APPLICATION, 2019–2025 (USD MILLION)
TABLE 33 MIDDLE EAST & AFRICA: VEIN ILLUMINATOR MARKET, BY END USER, 2019–2025 (USD MILLION)
LIST OF FIGURES
FIGURE 1 RESEARCH PROCESS
FIGURE 2 MARKET STRUCTURE FOR GLOBAL VEIN ILLUMINATOR MARKET
FIGURE 3 MARKET DYNAMICS FOR GLOBAL VEIN ILLUMINATOR MARKET
FIGURE 4 GLOBAL VEIN ILLUMINATOR MARKET SHARE, BY TECHNOLOGY, 2018 (%)
FIGURE 5 GLOBAL VEIN ILLUMINATOR MARKET SHARE, BY APPLICATION, 2018 (%)
FIGURE 6 GLOBAL VEIN ILLUMINATOR MARKET SHARE, BY END USER, 2018 (%)
FIGURE 7 GLOBAL VEIN ILLUMINATOR MARKET SHARE, BY REGION, 2018 (%)
FIGURE 8 NORTH AMERICA: VEIN ILLUMINATOR MARKET SHARE, BY COUNTRY, 2018 (%)
FIGURE 9 EUROPE: VEIN ILLUMINATOR MARKET SHARE, BY REGION, 2018 (%)
FIGURE 10 WESTERN EUROPE: VEIN ILLUMINATOR MARKET SHARE, BY COUNTRY, 2018 (%)
FIGURE 11 ASIA-PACIFIC: VEIN ILLUMINATOR MARKET SHARE, BY COUNTRY, 2018 (%)
FIGURE 12 MIDDLE EAST & AFRICA: VEIN ILLUMINATOR MARKET SHARE, BY REGION, 2018 (%)
FIGURE 13 GLOBAL VEIN ILLUMINATOR MARKET: COMPANY SHARE ANALYSIS, 2018 (%)
FIGURE 14 NEAR INFRARED IMAGING INC.: KEY FINANCIALS
FIGURE 15 NEAR INFRARED IMAGING INC.: SEGMENTAL REVENUE
FIGURE 16 NEAR INFRARED IMAGING INC: REGIONAL REVENUE
FIGURE 17 TRANSLITE LLC: KEY FINANCIALS
FIGURE 18 TRANSLITE LLC: SEGMENTAL REVENUE
FIGURE 19 TRANSLITE LLC: REGIONAL REVENUE
FIGURE 20 ACCUVEIN INC.: KEY FINANCIALS
FIGURE 21 ACCUVEIN INC.: SEGMENTAL REVENUE
FIGURE 22 ACCUVEIN INC.: REGIONAL REVENUE
FIGURE 23 SHARN ANESTHESIA: KEY FINANCIALS
FIGURE 24 SHARN ANESTHESIA: SEGMENTAL REVENUE
FIGURE 25 SHARN ANESTHESIA: REGIONAL REVENUE
FIGURE 26 CHRISTIE MEDICAL HOLDINGS, INC: KEY FINANCIALS
FIGURE 27 CHRISTIE MEDICAL HOLDINGS, INC: SEGMENTAL REVENUE
FIGURE 28 CHRISTIE MEDICAL HOLDINGS, INC: REGIONAL REVENUE
FIGURE 29 INFRARED IMAGING SYSTEMS, INC.: KEY FINANCIALS
FIGURE 30 INFRARED IMAGING SYSTEMS, INC.: SEGMENTAL REVENUE
FIGURE 31 INFRARED IMAGING SYSTEMS, INC.: REGIONAL REVENUE
FIGURE 32 VUETEK SCIENTIFIC LLC: KEY FINANCIALS
FIGURE 33 VUETEK SCIENTIFIC LLC: SEGMENTAL REVENUE
FIGURE 34 VUETEK SCIENTIFIC LLC: REGIONAL REVENUE
FIGURE 35 VENOSCOPE, LLC: KEY FINANCIALS
FIGURE 36 VENOSCOPE, LLC: SEGMENTAL REVENUE
FIGURE 37 VENOSCOPE, LLC: REGIONAL REVENUE
FIGURE 38 ZD MEDICAL INC.: KEY FINANCIALS
FIGURE 39 ZD MEDICAL INC.: SEGMENTAL REVENUE
FIGURE 40 ZD MEDICAL INC.: REGIONAL REVENUE
FIGURE 41 CAMBRIDGE MEDICAL GROUP: KEY FINANCIALS
FIGURE 42 CAMBRIDGE MEDICAL GROUP: SEGMENTAL REVENUE
FIGURE 43 CAMBRIDGE MEDICAL GROUP: REGIONAL REVENUE