SEGMENTATION QUICK REFERENCE
| Dimension | Sub-Segments | Dominant Segment | Fastest Growing Segment |
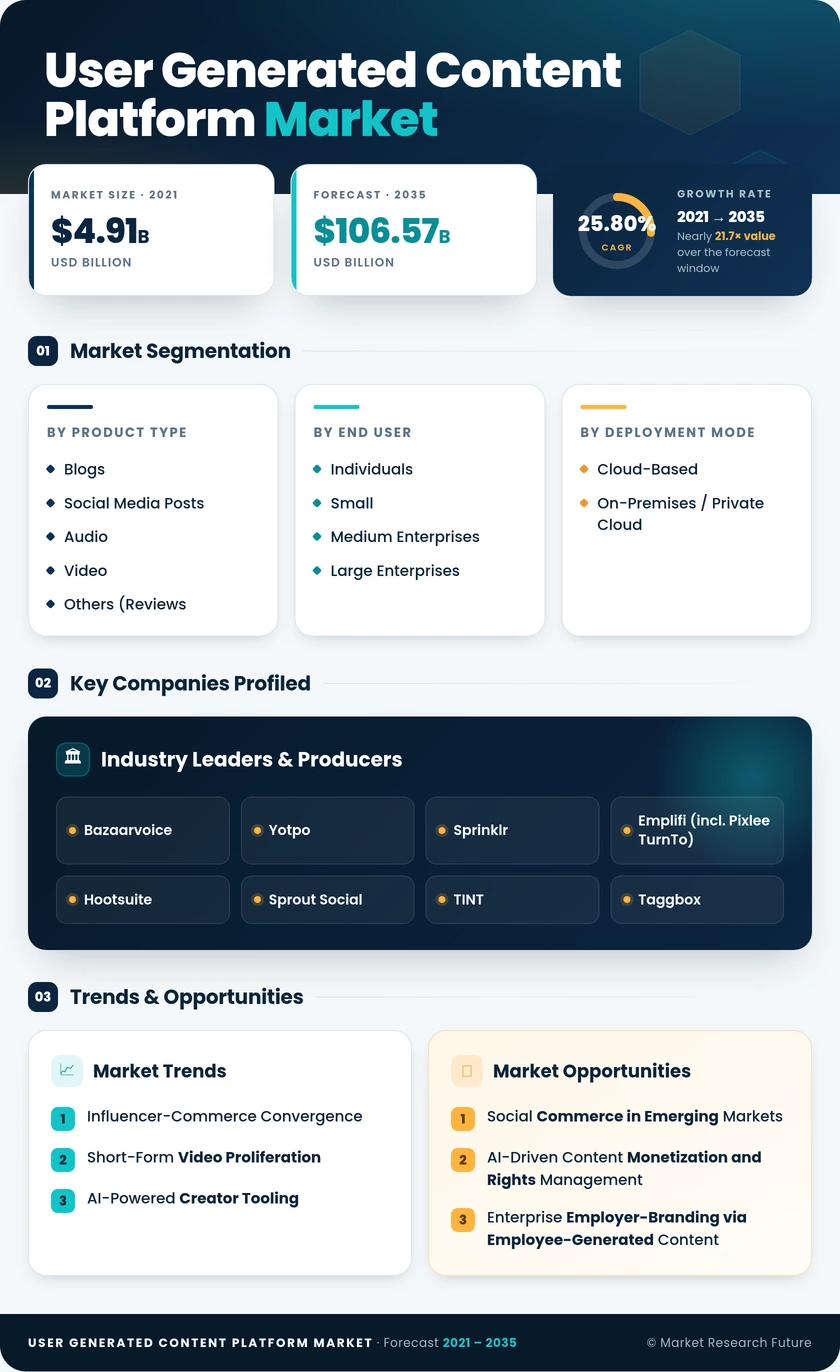
| Product Type | Blogs; Social Media Posts; Audio and Video; Others (Reviews, Forums) | Social Media Posts | Audio and Video (Live-Streaming) |
| End User | Individuals; Small and Medium Enterprises; Large Enterprises | Large Enterprises | Small and Medium Enterprises |
| Deployment Mode | Cloud-Based; On-Premises / Private Cloud | Cloud-Based | Cloud-Based |
| Revenue Model | Advertising-Supported; Subscription / SaaS; Freemium and Others | Advertising-Supported | Freemium and Others |
| Geography | North America; Europe; Asia-Pacific; South America; Middle East & Africa | North America | Asia-Pacific |
MARKET SEGMENTATION OVERVIEW
By Product Type
| Sub-Segment | Key Trend |
| Blogs | Long-form SEO content remains a durable traffic driver for B2B and media brands. |
| Social Media Posts | Shoppable UGC embeds on product pages are standard for e-commerce retailers. |
| Audio and Video | Live-streaming and short-form clips are the primary growth vector through 2035 |
| Others (Reviews, Forums) | Verified buyer reviews and community forums support post-purchase engagement. |
Social media posts dominate because platforms have built frictionless API pipelines connecting Instagram, TikTok, and Pinterest directly to brand storefronts. Audio and video content, particularly live-commerce streams, is gaining share rapidly as real-time interactivity deepens consumer engagement and compresses purchase decision cycles.
By End User
| Sub-Segment | Key Trend |
| Individuals | Creator monetization tools and personal-brand platforms drive adoption |
| Small and Medium Enterprises | Low-code, freemium UGC tools lower barriers to professional content curation |
| Large Enterprises | Multi-brand, multi-market UGC orchestration with enterprise-grade compliance |
Large enterprises anchor current revenue due to complex content-supply-chain needs. Still, SMEs represent the fastest growth trajectory as self-serve platforms democratize access to capabilities that were previously available only to well-funded marketing teams.
By Deployment Mode
| Sub-Segment | Key Trend |
| Cloud-Based | Default architecture offering scalability, automatic updates, and edge delivery |
| On-Premises / Private Cloud | Required by regulated industries with strict data-residency mandates |
Cloud-based deployment dominates and will continue to expand as platform vendors invest in global CDN coverage and auto-scaling moderation infrastructure. On-premises solutions retain a niche among healthcare, financial services, and government buyers.
By Revenue Model
| Sub-Segment | Key Trend |
| Advertising-Supported | Programmatic monetization of curated UGC galleries and sponsored placements |
| Subscription / SaaS | Predictable, contract-based pricing preferred by enterprise procurement teams |
| Freemium and Others | Free-tier onboarding serves as the primary customer-acquisition funnel for platform vendors. |
Advertising-supported models lead in revenue share, reflecting brands' willingness to pay for high-engagement, authentic content placements. Freemium offerings are the fastest-growing model as they convert small-brand users into paying subscribers through progressive feature unlocks.