US Vehicle Analytics Market

ID: MRFR/AT/13314-HCR
100 Pages
Triveni Bhoyar
Last Updated: April 06, 2026
US Vehicle Analytics Market Research Report By Component (Software Services, Professional Services, Deployment & Integration, Support & Maintenance, Consulting Services), By Application (Predictive Maintenance, Traffic Management, Warranty Analytics, Infotainment, Usage Based Insurance, Road Charging, Dealer Performance Analysis, Safety & Security Management, Driver & User Behavior Analysis) and By End User (Travel & Hospitality, Service Providers, Automotive Dealers, Fleet Owners, Insurers) - Forecast to 2035
Download PDF ×

We do not share your information with anyone. However, we may send you emails based on your report interest from time to time. You may contact us at any time to opt-out.

  1. 1 SECTION I: EXECUTIVE SUMMARY AND KEY HIGHLIGHTS
    1. 1.1 EXECUTIVE SUMMARY
      1. 1.1.1 Market Overview
      2. 1.1.2 Key Findings
      3. 1.1.3 Market Segmentation
      4. 1.1.4 Competitive Landscape
      5. 1.1.5 Challenges and Opportunities
      6. 1.1.6 Future Outlook
  2. 2 SECTION II: SCOPING, METHODOLOGY AND MARKET STRUCTURE
    1. 2.1 MARKET INTRODUCTION
      1. 2.1.1 Definition
      2. 2.1.2 Scope of the study
        1. 2.1.2.1 Research Objective
        2. 2.1.2.2 Assumption
        3. 2.1.2.3 Limitations
    2. 2.2 RESEARCH METHODOLOGY
      1. 2.2.1 Overview
      2. 2.2.2 Data Mining
      3. 2.2.3 Secondary Research
      4. 2.2.4 Primary Research
        1. 2.2.4.1 Primary Interviews and Information Gathering Process
        2. 2.2.4.2 Breakdown of Primary Respondents
      5. 2.2.5 Forecasting Model
      6. 2.2.6 Market Size Estimation
        1. 2.2.6.1 Bottom-Up Approach
        2. 2.2.6.2 Top-Down Approach
      7. 2.2.7 Data Triangulation
      8. 2.2.8 Validation
  3. 3 SECTION III: QUALITATIVE ANALYSIS
    1. 3.1 MARKET DYNAMICS
      1. 3.1.1 Overview
      2. 3.1.2 Drivers
      3. 3.1.3 Restraints
      4. 3.1.4 Opportunities
    2. 3.2 MARKET FACTOR ANALYSIS
      1. 3.2.1 Value chain Analysis
      2. 3.2.2 Porter's Five Forces Analysis
        1. 3.2.2.1 Bargaining Power of Suppliers
        2. 3.2.2.2 Bargaining Power of Buyers
        3. 3.2.2.3 Threat of New Entrants
        4. 3.2.2.4 Threat of Substitutes
        5. 3.2.2.5 Intensity of Rivalry
      3. 3.2.3 COVID-19 Impact Analysis
        1. 3.2.3.1 Market Impact Analysis
        2. 3.2.3.2 Regional Impact
        3. 3.2.3.3 Opportunity and Threat Analysis
  4. 4 SECTION IV: QUANTITATIVE ANALYSIS
    1. 4.1 Automobile, BY Component (USD Million)
      1. 4.1.1 Software Services
      2. 4.1.2 Professional Services
      3. 4.1.3 Deployment & Integration
      4. 4.1.4 Support & Maintenance
      5. 4.1.5 Consulting Services
    2. 4.2 Automobile, BY Deployment (USD Million)
      1. 4.2.1 On-Demand
      2. 4.2.2 On-Premise
    3. 4.3 Automobile, BY Application (USD Million)
      1. 4.3.1 Predictive Maintenance
      2. 4.3.2 Traffic Management
      3. 4.3.3 Warranty Analytics
      4. 4.3.4 Infotainment
      5. 4.3.5 Usage-Based Insurance
      6. 4.3.6 Road Charging
      7. 4.3.7 Dealer Performance Analysis
      8. 4.3.8 Safety & Security Management
      9. 4.3.9 Driver & User Behavior Analysis
    4. 4.4 Automobile, BY End User (USD Million)
      1. 4.4.1 Travel & Hospitality
      2. 4.4.2 Service Providers
      3. 4.4.3 Automotive Dealers
      4. 4.4.4 Fleet Owners
      5. 4.4.5 Insurers
      6. 4.4.6 Others
  5. 5 SECTION V: COMPETITIVE ANALYSIS
    1. 5.1 Competitive Landscape
      1. 5.1.1 Overview
      2. 5.1.2 Competitive Analysis
      3. 5.1.3 Market share Analysis
      4. 5.1.4 Major Growth Strategy in the Automobile
      5. 5.1.5 Competitive Benchmarking
      6. 5.1.6 Leading Players in Terms of Number of Developments in the Automobile
      7. 5.1.7 Key developments and growth strategies
        1. 5.1.7.1 New Product Launch/Service Deployment
        2. 5.1.7.2 Merger & Acquisitions
        3. 5.1.7.3 Joint Ventures
      8. 5.1.8 Major Players Financial Matrix
        1. 5.1.8.1 Sales and Operating Income
        2. 5.1.8.2 Major Players R&D Expenditure. 2023
    2. 5.2 Company Profiles
      1. 5.2.1 IBM (US)
        1. 5.2.1.1 Financial Overview
        2. 5.2.1.2 Products Offered
        3. 5.2.1.3 Key Developments
        4. 5.2.1.4 SWOT Analysis
        5. 5.2.1.5 Key Strategies
      2. 5.2.2 Oracle (US)
        1. 5.2.2.1 Financial Overview
        2. 5.2.2.2 Products Offered
        3. 5.2.2.3 Key Developments
        4. 5.2.2.4 SWOT Analysis
        5. 5.2.2.5 Key Strategies
      3. 5.2.3 SAP (DE)
        1. 5.2.3.1 Financial Overview
        2. 5.2.3.2 Products Offered
        3. 5.2.3.3 Key Developments
        4. 5.2.3.4 SWOT Analysis
        5. 5.2.3.5 Key Strategies
      4. 5.2.4 Microsoft (US)
        1. 5.2.4.1 Financial Overview
        2. 5.2.4.2 Products Offered
        3. 5.2.4.3 Key Developments
        4. 5.2.4.4 SWOT Analysis
        5. 5.2.4.5 Key Strategies
      5. 5.2.5 SAS (US)
        1. 5.2.5.1 Financial Overview
        2. 5.2.5.2 Products Offered
        3. 5.2.5.3 Key Developments
        4. 5.2.5.4 SWOT Analysis
        5. 5.2.5.5 Key Strategies
      6. 5.2.6 Teletrac Navman (NZ)
        1. 5.2.6.1 Financial Overview
        2. 5.2.6.2 Products Offered
        3. 5.2.6.3 Key Developments
        4. 5.2.6.4 SWOT Analysis
        5. 5.2.6.5 Key Strategies
      7. 5.2.7 Geotab (CA)
        1. 5.2.7.1 Financial Overview
        2. 5.2.7.2 Products Offered
        3. 5.2.7.3 Key Developments
        4. 5.2.7.4 SWOT Analysis
        5. 5.2.7.5 Key Strategies
      8. 5.2.8 Verizon Connect (US)
        1. 5.2.8.1 Financial Overview
        2. 5.2.8.2 Products Offered
        3. 5.2.8.3 Key Developments
        4. 5.2.8.4 SWOT Analysis
        5. 5.2.8.5 Key Strategies
      9. 5.2.9 Fleet Complete (CA)
        1. 5.2.9.1 Financial Overview
        2. 5.2.9.2 Products Offered
        3. 5.2.9.3 Key Developments
        4. 5.2.9.4 SWOT Analysis
        5. 5.2.9.5 Key Strategies
    3. 5.3 Appendix
      1. 5.3.1 References
      2. 5.3.2 Related Reports
  6. 6 LIST OF FIGURES
    1. 6.1 MARKET SYNOPSIS
    2. 6.2 US MARKET ANALYSIS BY COMPONENT
    3. 6.3 US MARKET ANALYSIS BY DEPLOYMENT
    4. 6.4 US MARKET ANALYSIS BY APPLICATION
    5. 6.5 US MARKET ANALYSIS BY END USER
    6. 6.6 KEY BUYING CRITERIA OF AUTOMOBILE
    7. 6.7 RESEARCH PROCESS OF MRFR
    8. 6.8 DRO ANALYSIS OF AUTOMOBILE
    9. 6.9 DRIVERS IMPACT ANALYSIS: AUTOMOBILE
    10. 6.10 RESTRAINTS IMPACT ANALYSIS: AUTOMOBILE
    11. 6.11 SUPPLY / VALUE CHAIN: AUTOMOBILE
    12. 6.12 AUTOMOBILE, BY COMPONENT, 2024 (% SHARE)
    13. 6.13 AUTOMOBILE, BY COMPONENT, 2024 TO 2035 (USD Million)
    14. 6.14 AUTOMOBILE, BY DEPLOYMENT, 2024 (% SHARE)
    15. 6.15 AUTOMOBILE, BY DEPLOYMENT, 2024 TO 2035 (USD Million)
    16. 6.16 AUTOMOBILE, BY APPLICATION, 2024 (% SHARE)
    17. 6.17 AUTOMOBILE, BY APPLICATION, 2024 TO 2035 (USD Million)
    18. 6.18 AUTOMOBILE, BY END USER, 2024 (% SHARE)
    19. 6.19 AUTOMOBILE, BY END USER, 2024 TO 2035 (USD Million)
    20. 6.20 BENCHMARKING OF MAJOR COMPETITORS
  7. 7 LIST OF TABLES
    1. 7.1 LIST OF ASSUMPTIONS
  8. 7.1.1
    1. 7.2 US MARKET SIZE ESTIMATES; FORECAST
      1. 7.2.1 BY COMPONENT, 2025-2035 (USD Million)
      2. 7.2.2 BY DEPLOYMENT, 2025-2035 (USD Million)
      3. 7.2.3 BY APPLICATION, 2025-2035 (USD Million)
      4. 7.2.4 BY END USER, 2025-2035 (USD Million)
    2. 7.3 PRODUCT LAUNCH/PRODUCT DEVELOPMENT/APPROVAL
  9. 7.3.1
    1. 7.4 ACQUISITION/PARTNERSHIP
  10. 7.4.1

US Automobile Market Segmentation

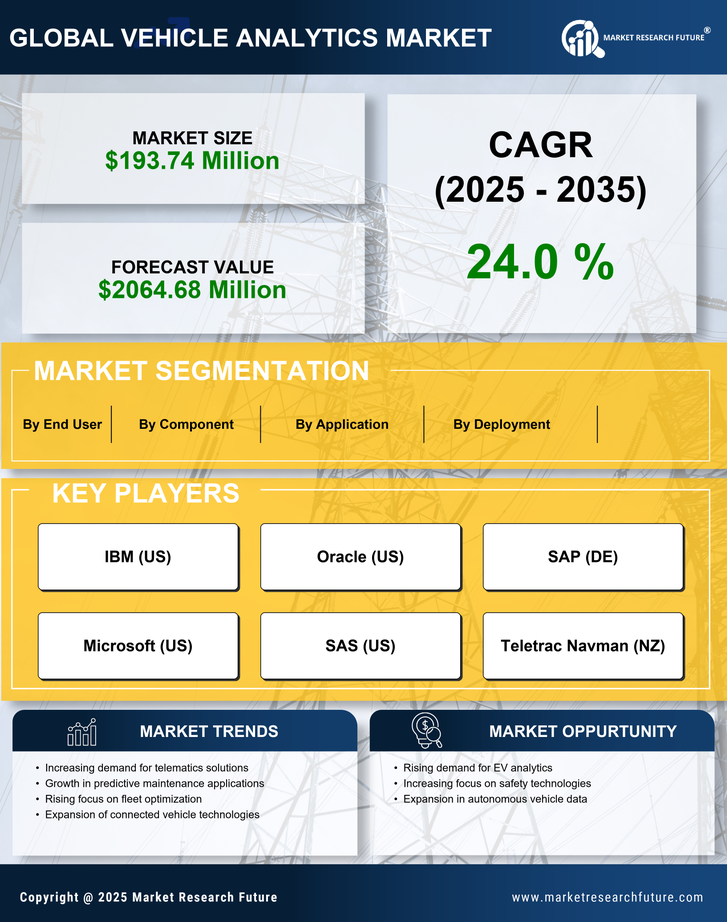
Automobile By Component (USD Million, 2025-2035)

  • Software Services
  • Professional Services
  • Deployment & Integration
  • Support & Maintenance
  • Consulting Services

Automobile By Deployment (USD Million, 2025-2035)

  • On-Demand
  • On-Premise

Automobile By Application (USD Million, 2025-2035)

  • Predictive Maintenance
  • Traffic Management
  • Warranty Analytics
  • Infotainment
  • Usage-Based Insurance
  • Road Charging
  • Dealer Performance Analysis
  • Safety & Security Management
  • Driver & User Behavior Analysis

Automobile By End User (USD Million, 2025-2035)

  • Travel & Hospitality
  • Service Providers
  • Automotive Dealers
  • Fleet Owners
  • Insurers
  • Others