US Pharmaceutical Market Segmentation
Pharmaceutical By Type (USD Million, 2025-2035)
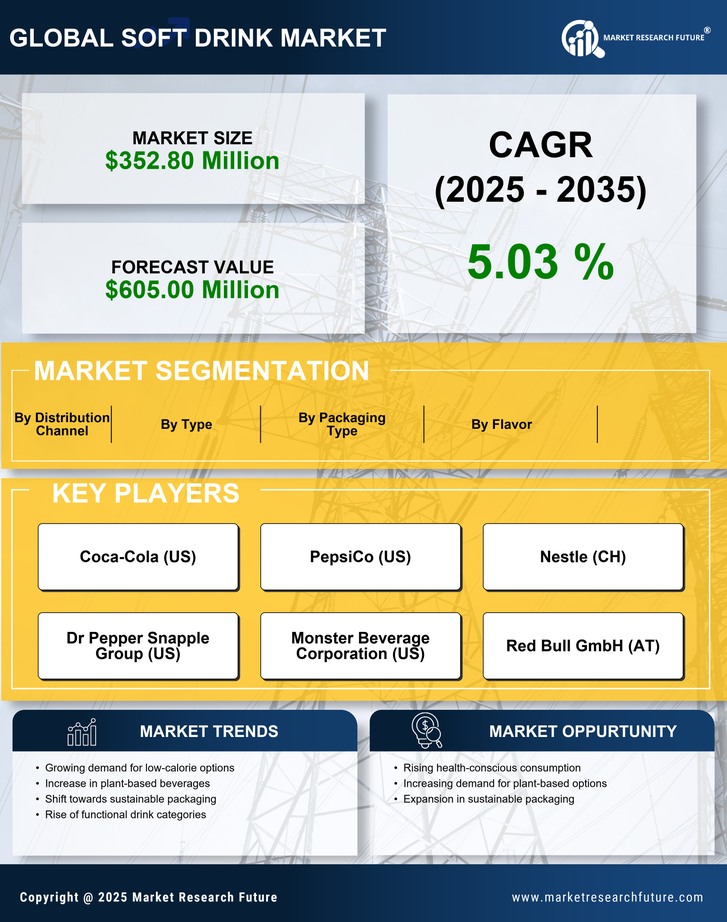
- Carbonated Soft Drinks
- Non-Carbonated Soft Drinks
- Juices
- Sports Drinks
- Energy Drinks
Pharmaceutical By Flavor (USD Million, 2025-2035)
- Cola
- Fruit
- Citrus
- Herbal
- Mixed Flavors
Pharmaceutical By Packaging Type (USD Million, 2025-2035)
- Cans
- Bottles
- Pouches
- Tetra Packs
- Bulk Packaging
Pharmaceutical By Distribution Channel (USD Million, 2025-2035)
- Supermarkets
- Convenience Stores
- Online Retail
- Restaurants
- Vending Machines