US Self Service Analytics Market Segmentation
US Self Service Analytics Market By Type (USD Million, 2025-2035)
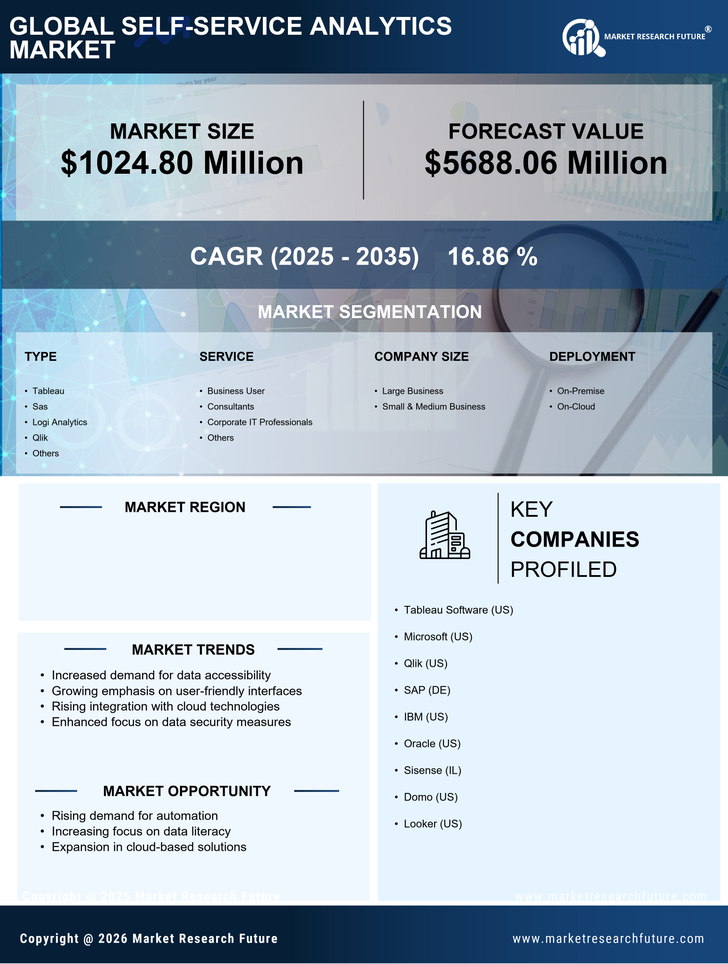
- Tableau
- Sas
- Logi Analytics
- Qlik
- Others
US Self Service Analytics Market By Service (USD Million, 2025-2035)
- Business User
- Consultants
- Corporate IT Professionals
- Others
US Self Service Analytics Market By Company Size (USD Million, 2025-2035)
- Large Business
- Small & Medium Business
US Self Service Analytics Market By Deployment (USD Million, 2025-2035)
- On-Premise
- On-Cloud
US Self Service Analytics Market By Industries (USD Million, 2025-2035)
- BFSI
- US Self Service Analytics Market
- Retail
- IT & Telecommunication
- Others