US Life Sciences Market Segmentation
Life Sciences By Type (USD Million, 2025-2035)
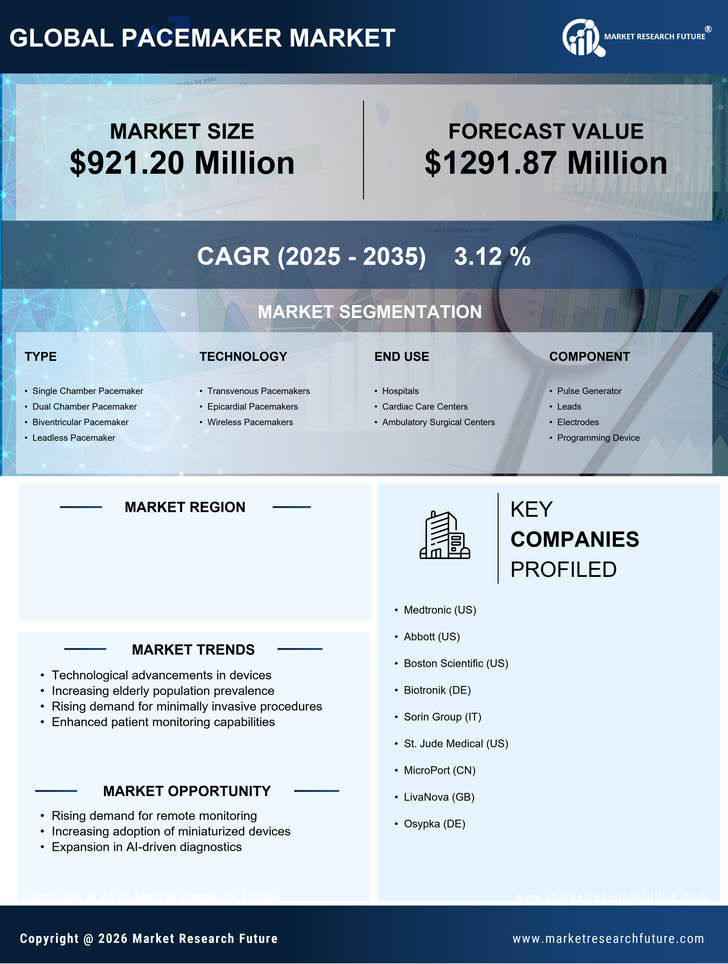
- Single Chamber Pacemaker
- Dual Chamber Pacemaker
- Biventricular Pacemaker
- Leadless Pacemaker
Life Sciences By Technology (USD Million, 2025-2035)
- Transvenous Pacemakers
- Epicardial Pacemakers
- Wireless Pacemakers
Life Sciences By End Use (USD Million, 2025-2035)
- Hospitals
- Cardiac Care Centers
- Ambulatory Surgical Centers
Life Sciences By Component (USD Million, 2025-2035)
- Pulse Generator
- Leads
- Electrodes
- Programming Device