Request Free Sample ×

Kindly complete the form below to receive a free sample of this Report

* Please use a valid business email

Leading companies partner with us for data-driven Insights

clients tt-cursor
Hero Background

US Omega 3 PUFA Market

ID: MRFR/FnB/11643-HCR
100 Pages
Garvit Vyas
Last Updated: April 06, 2026

US Omega-3 PUFA Market Size, Share, Industry Trend & Analysis Research Report Information by Type (Docosahexaenoic Acid [DHA], Eicosapentaenoic Acid [EPA], Alpha-Linolenic Acid [ALA]), Source (Plant Sources [Flaxseed, Chia Seed, and others], Marine Sources [Fish, Algae, Krill and others]), Application (Functional Food & Beverages, Dietary Supplements, Infant Formula, Pharmaceuticals & Nutraceuticals and others) and Region (North America, Europe, Asia-Pacific and Rest of the World) - Forecast till 2035

Share:
Download PDF ×

We do not share your information with anyone. However, we may send you emails based on your report interest from time to time. You may contact us at any time to opt-out.

  1. 1 SECTION I: EXECUTIVE SUMMARY AND KEY HIGHLIGHTS
    1. 1.1 EXECUTIVE SUMMARY
      1. 1.1.1 Market Overview
      2. 1.1.2 Key Findings
      3. 1.1.3 Market Segmentation
      4. 1.1.4 Competitive Landscape
      5. 1.1.5 Challenges and Opportunities
      6. 1.1.6 Future Outlook
  2. 2 SECTION II: SCOPING, METHODOLOGY AND MARKET STRUCTURE
    1. 2.1 MARKET INTRODUCTION
      1. 2.1.1 Definition
      2. 2.1.2 Scope of the study
        1. 2.1.2.1 Research Objective
        2. 2.1.2.2 Assumption
        3. 2.1.2.3 Limitations
    2. 2.2 RESEARCH METHODOLOGY
      1. 2.2.1 Overview
      2. 2.2.2 Data Mining
      3. 2.2.3 Secondary Research
      4. 2.2.4 Primary Research
        1. 2.2.4.1 Primary Interviews and Information Gathering Process
        2. 2.2.4.2 Breakdown of Primary Respondents
      5. 2.2.5 Forecasting Model
      6. 2.2.6 Market Size Estimation
        1. 2.2.6.1 Bottom-Up Approach
        2. 2.2.6.2 Top-Down Approach
      7. 2.2.7 Data Triangulation
      8. 2.2.8 Validation
  3. 3 SECTION III: QUALITATIVE ANALYSIS
    1. 3.1 MARKET DYNAMICS
      1. 3.1.1 Overview
      2. 3.1.2 Drivers
      3. 3.1.3 Restraints
      4. 3.1.4 Opportunities
    2. 3.2 MARKET FACTOR ANALYSIS
      1. 3.2.1 Value chain Analysis
      2. 3.2.2 Porter's Five Forces Analysis
        1. 3.2.2.1 Bargaining Power of Suppliers
        2. 3.2.2.2 Bargaining Power of Buyers
        3. 3.2.2.3 Threat of New Entrants
        4. 3.2.2.4 Threat of Substitutes
        5. 3.2.2.5 Intensity of Rivalry
      3. 3.2.3 COVID-19 Impact Analysis
        1. 3.2.3.1 Market Impact Analysis
        2. 3.2.3.2 Regional Impact
        3. 3.2.3.3 Opportunity and Threat Analysis
  4. 4 SECTION IV: QUANTITATIVE ANALYSIS
    1. 4.1 Food, Beverages & Nutrition, BY Source (USD Billion)
      1. 4.1.1 Fish Oil
      2. 4.1.2 Krill Oil
      3. 4.1.3 Algal Oil
      4. 4.1.4 Flaxseed Oil
      5. 4.1.5 Chia Seed Oil
    2. 4.2 Food, Beverages & Nutrition, BY Application (USD Billion)
      1. 4.2.1 Nutraceuticals
      2. 4.2.2 Pharmaceuticals
      3. 4.2.3 Functional Foods
      4. 4.2.4 Animal Feed
      5. 4.2.5 Cosmetics
    3. 4.3 Food, Beverages & Nutrition, BY Form (USD Billion)
      1. 4.3.1 Liquid
      2. 4.3.2 Softgels
      3. 4.3.3 Capsules
      4. 4.3.4 Powder
      5. 4.3.5 Emulsified
    4. 4.4 Food, Beverages & Nutrition, BY End Use (USD Billion)
      1. 4.4.1 Dietary Supplements
      2. 4.4.2 Food and Beverages
      3. 4.4.3 Animal Nutrition
  5. 5 SECTION V: COMPETITIVE ANALYSIS
    1. 5.1 Competitive Landscape
      1. 5.1.1 Overview
      2. 5.1.2 Competitive Analysis
      3. 5.1.3 Market share Analysis
      4. 5.1.4 Major Growth Strategy in the Food, Beverages & Nutrition
      5. 5.1.5 Competitive Benchmarking
      6. 5.1.6 Leading Players in Terms of Number of Developments in the Food, Beverages & Nutrition
      7. 5.1.7 Key developments and growth strategies
        1. 5.1.7.1 New Product Launch/Service Deployment
        2. 5.1.7.2 Merger & Acquisitions
        3. 5.1.7.3 Joint Ventures
      8. 5.1.8 Major Players Financial Matrix
        1. 5.1.8.1 Sales and Operating Income
        2. 5.1.8.2 Major Players R&D Expenditure. 2023
    2. 5.2 Company Profiles
      1. 5.2.1 DSM Nutritional Products (CH)
        1. 5.2.1.1 Financial Overview
        2. 5.2.1.2 Products Offered
        3. 5.2.1.3 Key Developments
        4. 5.2.1.4 SWOT Analysis
        5. 5.2.1.5 Key Strategies
      2. 5.2.2 BASF SE (DE)
        1. 5.2.2.1 Financial Overview
        2. 5.2.2.2 Products Offered
        3. 5.2.2.3 Key Developments
        4. 5.2.2.4 SWOT Analysis
        5. 5.2.2.5 Key Strategies
      3. 5.2.3 Cargill, Inc. (US)
        1. 5.2.3.1 Financial Overview
        2. 5.2.3.2 Products Offered
        3. 5.2.3.3 Key Developments
        4. 5.2.3.4 SWOT Analysis
        5. 5.2.3.5 Key Strategies
      4. 5.2.4 Omega Protein Corporation (US)
        1. 5.2.4.1 Financial Overview
        2. 5.2.4.2 Products Offered
        3. 5.2.4.3 Key Developments
        4. 5.2.4.4 SWOT Analysis
        5. 5.2.4.5 Key Strategies
      5. 5.2.5 Martek Biosciences Corporation (US)
        1. 5.2.5.1 Financial Overview
        2. 5.2.5.2 Products Offered
        3. 5.2.5.3 Key Developments
        4. 5.2.5.4 SWOT Analysis
        5. 5.2.5.5 Key Strategies
      6. 5.2.6 Nordic Naturals (US)
        1. 5.2.6.1 Financial Overview
        2. 5.2.6.2 Products Offered
        3. 5.2.6.3 Key Developments
        4. 5.2.6.4 SWOT Analysis
        5. 5.2.6.5 Key Strategies
      7. 5.2.7 Kirkland Signature (US)
        1. 5.2.7.1 Financial Overview
        2. 5.2.7.2 Products Offered
        3. 5.2.7.3 Key Developments
        4. 5.2.7.4 SWOT Analysis
        5. 5.2.7.5 Key Strategies
      8. 5.2.8 Nature's Way Products, LLC (US)
        1. 5.2.8.1 Financial Overview
        2. 5.2.8.2 Products Offered
        3. 5.2.8.3 Key Developments
        4. 5.2.8.4 SWOT Analysis
        5. 5.2.8.5 Key Strategies
    3. 5.3 Appendix
      1. 5.3.1 References
      2. 5.3.2 Related Reports
  6. 6 LIST OF FIGURES
    1. 6.1 MARKET SYNOPSIS
    2. 6.2 US MARKET ANALYSIS BY SOURCE
    3. 6.3 US MARKET ANALYSIS BY APPLICATION
    4. 6.4 US MARKET ANALYSIS BY FORM
    5. 6.5 US MARKET ANALYSIS BY END USE
    6. 6.6 KEY BUYING CRITERIA OF FOOD, BEVERAGES & NUTRITION
    7. 6.7 RESEARCH PROCESS OF MRFR
    8. 6.8 DRO ANALYSIS OF FOOD, BEVERAGES & NUTRITION
    9. 6.9 DRIVERS IMPACT ANALYSIS: FOOD, BEVERAGES & NUTRITION
    10. 6.10 RESTRAINTS IMPACT ANALYSIS: FOOD, BEVERAGES & NUTRITION
    11. 6.11 SUPPLY / VALUE CHAIN: FOOD, BEVERAGES & NUTRITION
    12. 6.12 FOOD, BEVERAGES & NUTRITION, BY SOURCE, 2024 (% SHARE)
    13. 6.13 FOOD, BEVERAGES & NUTRITION, BY SOURCE, 2024 TO 2035 (USD Billion)
    14. 6.14 FOOD, BEVERAGES & NUTRITION, BY APPLICATION, 2024 (% SHARE)
    15. 6.15 FOOD, BEVERAGES & NUTRITION, BY APPLICATION, 2024 TO 2035 (USD Billion)
    16. 6.16 FOOD, BEVERAGES & NUTRITION, BY FORM, 2024 (% SHARE)
    17. 6.17 FOOD, BEVERAGES & NUTRITION, BY FORM, 2024 TO 2035 (USD Billion)
    18. 6.18 FOOD, BEVERAGES & NUTRITION, BY END USE, 2024 (% SHARE)
    19. 6.19 FOOD, BEVERAGES & NUTRITION, BY END USE, 2024 TO 2035 (USD Billion)
    20. 6.20 BENCHMARKING OF MAJOR COMPETITORS
  7. 7 LIST OF TABLES
    1. 7.1 LIST OF ASSUMPTIONS
  8. 7.1.1
    1. 7.2 US MARKET SIZE ESTIMATES; FORECAST
      1. 7.2.1 BY SOURCE, 2025-2035 (USD Billion)
      2. 7.2.2 BY APPLICATION, 2025-2035 (USD Billion)
      3. 7.2.3 BY FORM, 2025-2035 (USD Billion)
      4. 7.2.4 BY END USE, 2025-2035 (USD Billion)
    2. 7.3 PRODUCT LAUNCH/PRODUCT DEVELOPMENT/APPROVAL
  9. 7.3.1
    1. 7.4 ACQUISITION/PARTNERSHIP
  10. 7.4.1

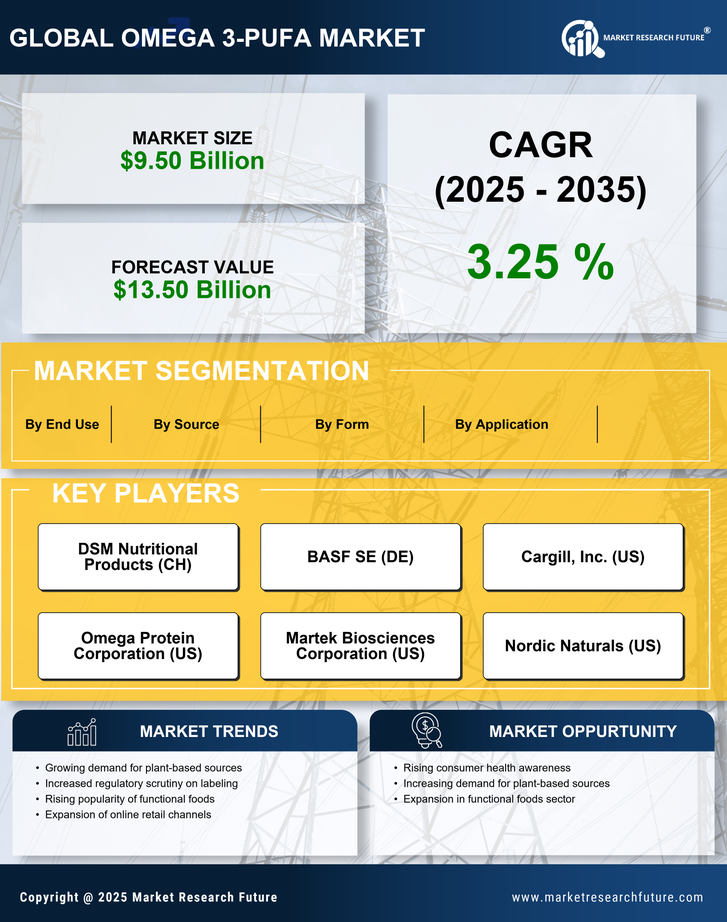
US Food, Beverages & Nutrition Market Segmentation

Food, Beverages & Nutrition By Source (USD Billion, 2025-2035)

  • Fish Oil
  • Krill Oil
  • Algal Oil
  • Flaxseed Oil
  • Chia Seed Oil

Food, Beverages & Nutrition By Application (USD Billion, 2025-2035)

  • Nutraceuticals
  • Pharmaceuticals
  • Functional Foods
  • Animal Feed
  • Cosmetics

Food, Beverages & Nutrition By Form (USD Billion, 2025-2035)

  • Liquid
  • Softgels
  • Capsules
  • Powder
  • Emulsified

Food, Beverages & Nutrition By End Use (USD Billion, 2025-2035)

  • Dietary Supplements
  • Food and Beverages
  • Animal Nutrition

Compare Licence

×
Features License Type
Single User Multiuser License Enterprise User
Price $4,950 $5,950 $7,250
Maximum User Access Limit 1 User Upto 10 Users Unrestricted Access Throughout the Organization
Free Customization
Direct Access to Analyst
Deliverable Format
Platform Access
Discount on Next Purchase 10% 15% 15%
Printable Versions