

US Life Sciences Market Segmentation
Life Sciences By Application (USD Million, 2025-2035)
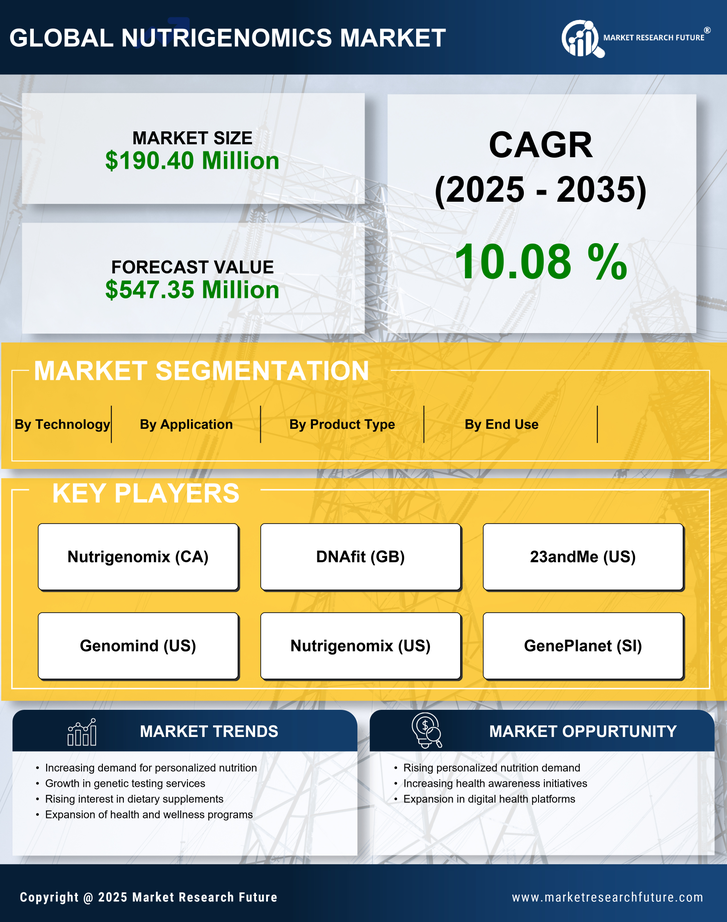
- Personalized Nutrition
- Disease Prevention
- Health Optimization
- Fitness and Athletic Performance
Life Sciences By End Use (USD Million, 2025-2035)
- Healthcare
- Dietary Supplements
- Food
- Beverage
- Pharmaceuticals
Life Sciences By Product Type (USD Million, 2025-2035)
- Genetic Testing Kits
- Bioinformatics Tools
- Nutritional Analysis Software
Life Sciences By Technology (USD Million, 2025-2035)
- DNA Sequencing
- Microarray Analysis
- Polymerase Chain Reaction


