

US Industrial Automation & Equipment Market Segmentation
Industrial Automation & Equipment By Technology (USD Million, 2025-2035)
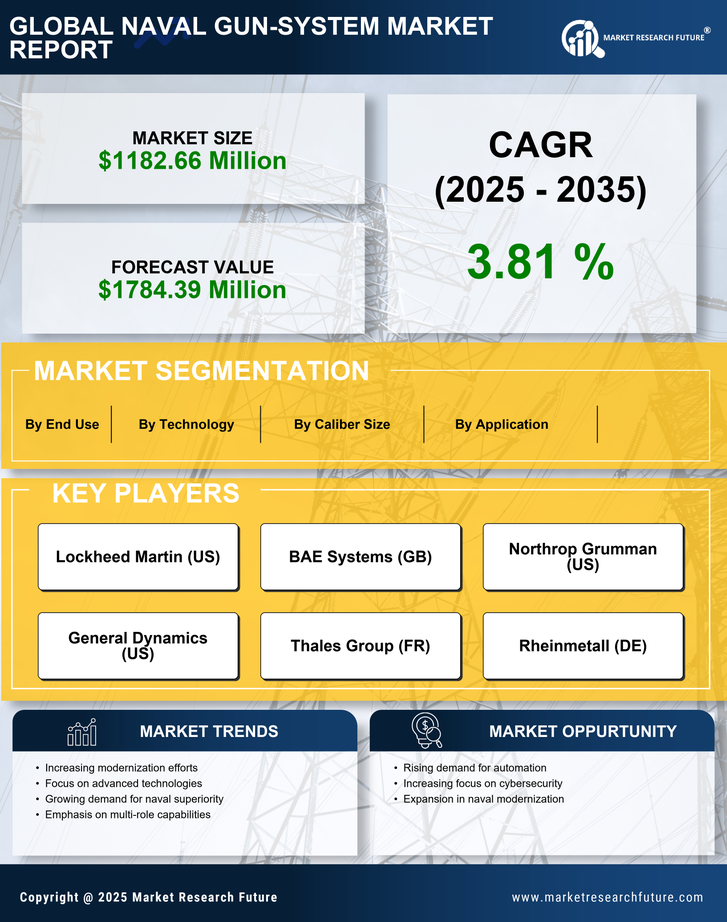
- Electromagnetic Railgun
- Conventional Gun Systems
- Smart Munitions
- Automated Gun Systems
Industrial Automation & Equipment By Application (USD Million, 2025-2035)
- Surface Warfare
- Anti-Air Warfare
- Land Attack
- Undersea Warfare
Industrial Automation & Equipment By Caliber Size (USD Million, 2025-2035)
- Small Caliber
- Medium Caliber
- Large Caliber
Industrial Automation & Equipment By End Use (USD Million, 2025-2035)
- Military Naval Forces
- Coast Guard
- Commercial Shipping


