

US Chemicals and Materials Market Segmentation
Chemicals and Materials By Type (USD Million, 2025-2035)
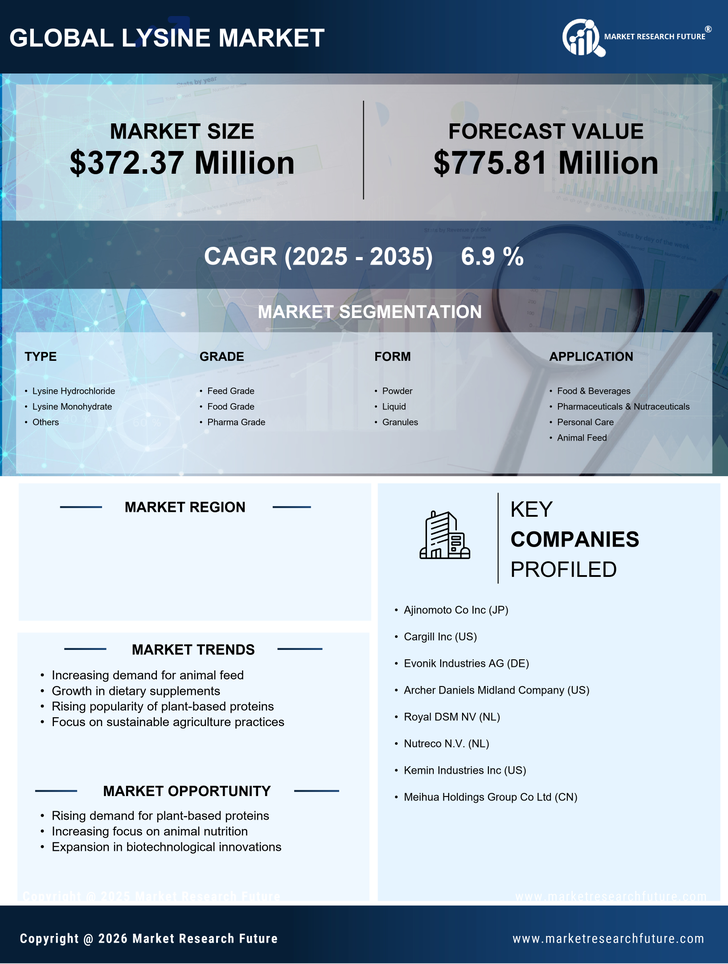
- Lysine Hydrochloride
- Lysine Monohydrate
- Others
Chemicals and Materials By Grade (USD Million, 2025-2035)
- Feed Grade
- Food Grade
- Pharma Grade
Chemicals and Materials By Form (USD Million, 2025-2035)
- Powder
- Liquid
- Granules
Chemicals and Materials By Application (USD Million, 2025-2035)
- Food & Beverages
- Pharmaceuticals & Nutraceuticals
- Personal Care
- Animal Feed


