Request Free Sample ×

Kindly complete the form below to receive a free sample of this Report

* Please use a valid business email

Leading companies partner with us for data-driven Insights

clients tt-cursor
Hero Background

US Industrial Filtration Market

ID: MRFR/Equip/16695-HCR
100 Pages
Garvit Vyas
Last Updated: April 06, 2026

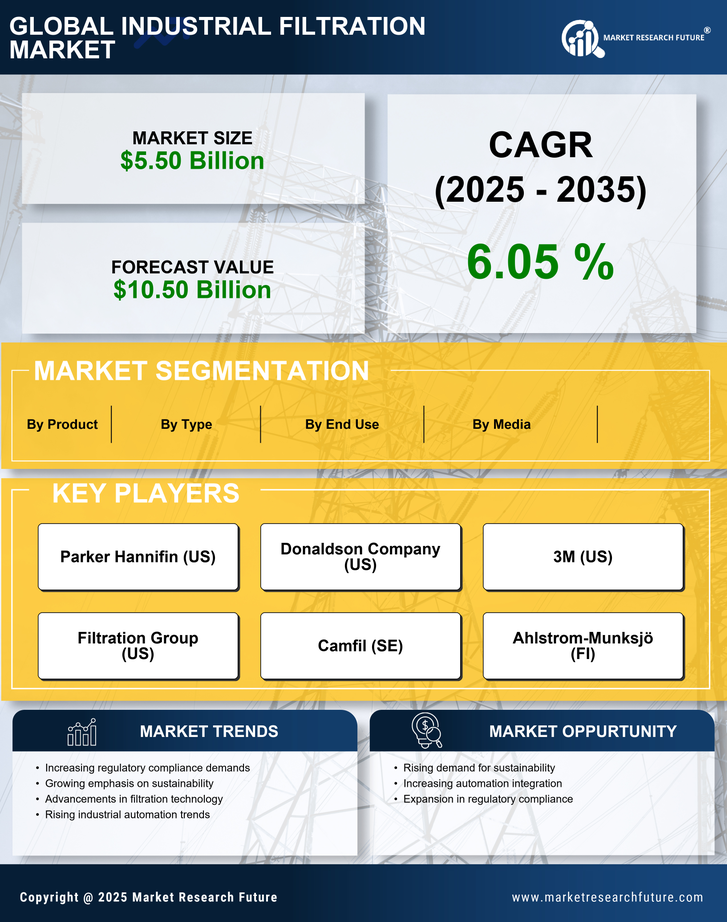
US Industrial Filtration Market Research Report By Type (Liquid Filtration, Others), By Media (Filter Cloth, Others), By End Use (Food & Beverages, Chemicals, Petrochemicals, Power Generation, Oil & Gas, Rubber & Plastics, Bio-products, Pharmaceuticals, Metal & Mining, Battery Materials & Chemicals, Industrial Minerals, Pulp & Paper, Others), By Product (Tower Press, Vacuum Belt Filters, Filter Press, Centrifuge Filter, LSF Filter, Drum Filter, Leaf Filter, Belt Presses, Others) – United States Market Forecast Till 2035

Share:
Download PDF ×

We do not share your information with anyone. However, we may send you emails based on your report interest from time to time. You may contact us at any time to opt-out.

US Industrial Filtration Market Infographic
Purchase Options
  1. 1 SECTION I: EXECUTIVE SUMMARY AND KEY HIGHLIGHTS
  2.   1.1 EXECUTIVE SUMMARY
  3.     1.1.1 Market Overview
  4.     1.1.2 Key Findings
  5.     1.1.3 Market Segmentation
  6.     1.1.4 Competitive Landscape
  7.     1.1.5 Challenges and Opportunities
  8.     1.1.6 Future Outlook
  9. 2 SECTION II: SCOPING, METHODOLOGY AND MARKET STRUCTURE
  10.   2.1 MARKET INTRODUCTION
  11.     2.1.1 Definition
  12.     2.1.2 Scope of the study
  13.       2.1.2.1 Research Objective
  14.       2.1.2.2 Assumption
  15.       2.1.2.3 Limitations
  16.   2.2 RESEARCH METHODOLOGY
  17.     2.2.1 Overview
  18.     2.2.2 Data Mining
  19.     2.2.3 Secondary Research
  20.     2.2.4 Primary Research
  21.       2.2.4.1 Primary Interviews and Information Gathering Process
  22.       2.2.4.2 Breakdown of Primary Respondents
  23.     2.2.5 Forecasting Model
  24.     2.2.6 Market Size Estimation
  25.       2.2.6.1 Bottom-Up Approach
  26.       2.2.6.2 Top-Down Approach
  27.     2.2.7 Data Triangulation
  28.     2.2.8 Validation
  29. 3 SECTION III: QUALITATIVE ANALYSIS
  30.   3.1 MARKET DYNAMICS
  31.     3.1.1 Overview
  32.     3.1.2 Drivers
  33.     3.1.3 Restraints
  34.     3.1.4 Opportunities
  35.   3.2 MARKET FACTOR ANALYSIS
  36.     3.2.1 Value chain Analysis
  37.     3.2.2 Porter's Five Forces Analysis
  38.       3.2.2.1 Bargaining Power of Suppliers
  39.       3.2.2.2 Bargaining Power of Buyers
  40.       3.2.2.3 Threat of New Entrants
  41.       3.2.2.4 Threat of Substitutes
  42.       3.2.2.5 Intensity of Rivalry
  43.     3.2.3 COVID-19 Impact Analysis
  44.       3.2.3.1 Market Impact Analysis
  45.       3.2.3.2 Regional Impact
  46.       3.2.3.3 Opportunity and Threat Analysis
  47. 4 SECTION IV: QUANTITATIVE ANALYSIS
  48.   4.1 Food, Beverages & Nutrition, BY Type (USD Billion)
  49.     4.1.1 Liquid Filtration
  50.     4.1.2 Others
  51.   4.2 Food, Beverages & Nutrition, BY Media (USD Billion)
  52.     4.2.1 Filter Cloth
  53.     4.2.2 Others
  54.   4.3 Food, Beverages & Nutrition, BY End Use (USD Billion)
  55.     4.3.1 Food & Beverages
  56.     4.3.2 Chemicals
  57.     4.3.3 Petrochemicals
  58.     4.3.4 Power Generation
  59.     4.3.5 Oil & Gas
  60.     4.3.6 Rubber & Plastics
  61.     4.3.7 Bio-products
  62.     4.3.8 Pharmaceuticals
  63.     4.3.9 Metal & Mining
  64.     4.3.10 Battery Materials & Chemicals
  65.     4.3.11 Industrial Minerals
  66.     4.3.12 Pulp & Paper
  67.     4.3.13 Others
  68.   4.4 Food, Beverages & Nutrition, BY Product (USD Billion)
  69.     4.4.1 Tower Press
  70.     4.4.2 Vacuum Belt Filters
  71.     4.4.3 Filter Press
  72.     4.4.4 Centrifuge Filter
  73.     4.4.5 LSF Filter
  74.     4.4.6 Drum Filter
  75.     4.4.7 Leaf Filter
  76.     4.4.8 Belt Presses
  77.     4.4.9 Others
  78. 5 SECTION V: COMPETITIVE ANALYSIS
  79.   5.1 Competitive Landscape
  80.     5.1.1 Overview
  81.     5.1.2 Competitive Analysis
  82.     5.1.3 Market share Analysis
  83.     5.1.4 Major Growth Strategy in the Food, Beverages & Nutrition
  84.     5.1.5 Competitive Benchmarking
  85.     5.1.6 Leading Players in Terms of Number of Developments in the Food, Beverages & Nutrition
  86.     5.1.7 Key developments and growth strategies
  87.       5.1.7.1 New Product Launch/Service Deployment
  88.       5.1.7.2 Merger & Acquisitions
  89.       5.1.7.3 Joint Ventures
  90.     5.1.8 Major Players Financial Matrix
  91.       5.1.8.1 Sales and Operating Income
  92.       5.1.8.2 Major Players R&D Expenditure. 2023
  93.   5.2 Company Profiles
  94.     5.2.1 Parker Hannifin (US)
  95.       5.2.1.1 Financial Overview
  96.       5.2.1.2 Products Offered
  97.       5.2.1.3 Key Developments
  98.       5.2.1.4 SWOT Analysis
  99.       5.2.1.5 Key Strategies
  100.     5.2.2 Donaldson Company (US)
  101.       5.2.2.1 Financial Overview
  102.       5.2.2.2 Products Offered
  103.       5.2.2.3 Key Developments
  104.       5.2.2.4 SWOT Analysis
  105.       5.2.2.5 Key Strategies
  106.     5.2.3 3M (US)
  107.       5.2.3.1 Financial Overview
  108.       5.2.3.2 Products Offered
  109.       5.2.3.3 Key Developments
  110.       5.2.3.4 SWOT Analysis
  111.       5.2.3.5 Key Strategies
  112.     5.2.4 Filtration Group (US)
  113.       5.2.4.1 Financial Overview
  114.       5.2.4.2 Products Offered
  115.       5.2.4.3 Key Developments
  116.       5.2.4.4 SWOT Analysis
  117.       5.2.4.5 Key Strategies
  118.     5.2.5 Camfil (SE)
  119.       5.2.5.1 Financial Overview
  120.       5.2.5.2 Products Offered
  121.       5.2.5.3 Key Developments
  122.       5.2.5.4 SWOT Analysis
  123.       5.2.5.5 Key Strategies
  124.     5.2.6 Ahlstrom-Munksjö (FI)
  125.       5.2.6.1 Financial Overview
  126.       5.2.6.2 Products Offered
  127.       5.2.6.3 Key Developments
  128.       5.2.6.4 SWOT Analysis
  129.       5.2.6.5 Key Strategies
  130.     5.2.7 Eaton Corporation (US)
  131.       5.2.7.1 Financial Overview
  132.       5.2.7.2 Products Offered
  133.       5.2.7.3 Key Developments
  134.       5.2.7.4 SWOT Analysis
  135.       5.2.7.5 Key Strategies
  136.     5.2.8 Mann+Hummel (DE)
  137.       5.2.8.1 Financial Overview
  138.       5.2.8.2 Products Offered
  139.       5.2.8.3 Key Developments
  140.       5.2.8.4 SWOT Analysis
  141.       5.2.8.5 Key Strategies
  142.     5.2.9 Gore (US)
  143.       5.2.9.1 Financial Overview
  144.       5.2.9.2 Products Offered
  145.       5.2.9.3 Key Developments
  146.       5.2.9.4 SWOT Analysis
  147.       5.2.9.5 Key Strategies
  148.   5.3 Appendix
  149.     5.3.1 References
  150.     5.3.2 Related Reports
  151. 6 LIST OF FIGURES
  152.   6.1 MARKET SYNOPSIS
  153.   6.2 US MARKET ANALYSIS BY TYPE
  154.   6.3 US MARKET ANALYSIS BY MEDIA
  155.   6.4 US MARKET ANALYSIS BY END USE
  156.   6.5 US MARKET ANALYSIS BY PRODUCT
  157.   6.6 KEY BUYING CRITERIA OF FOOD, BEVERAGES & NUTRITION
  158.   6.7 RESEARCH PROCESS OF MRFR
  159.   6.8 DRO ANALYSIS OF FOOD, BEVERAGES & NUTRITION
  160.   6.9 DRIVERS IMPACT ANALYSIS: FOOD, BEVERAGES & NUTRITION
  161.   6.10 RESTRAINTS IMPACT ANALYSIS: FOOD, BEVERAGES & NUTRITION
  162.   6.11 SUPPLY / VALUE CHAIN: FOOD, BEVERAGES & NUTRITION
  163.   6.12 FOOD, BEVERAGES & NUTRITION, BY TYPE, 2024 (% SHARE)
  164.   6.13 FOOD, BEVERAGES & NUTRITION, BY TYPE, 2024 TO 2035 (USD Billion)
  165.   6.14 FOOD, BEVERAGES & NUTRITION, BY MEDIA, 2024 (% SHARE)
  166.   6.15 FOOD, BEVERAGES & NUTRITION, BY MEDIA, 2024 TO 2035 (USD Billion)
  167.   6.16 FOOD, BEVERAGES & NUTRITION, BY END USE, 2024 (% SHARE)
  168.   6.17 FOOD, BEVERAGES & NUTRITION, BY END USE, 2024 TO 2035 (USD Billion)
  169.   6.18 FOOD, BEVERAGES & NUTRITION, BY PRODUCT, 2024 (% SHARE)
  170.   6.19 FOOD, BEVERAGES & NUTRITION, BY PRODUCT, 2024 TO 2035 (USD Billion)
  171.   6.20 BENCHMARKING OF MAJOR COMPETITORS
  172. 7 LIST OF TABLES
  173.   7.1 LIST OF ASSUMPTIONS
  174.     7.1.1
  175.   7.2 US MARKET SIZE ESTIMATES; FORECAST
  176.     7.2.1 BY TYPE, 2025-2035 (USD Billion)
  177.     7.2.2 BY MEDIA, 2025-2035 (USD Billion)
  178.     7.2.3 BY END USE, 2025-2035 (USD Billion)
  179.     7.2.4 BY PRODUCT, 2025-2035 (USD Billion)
  180.   7.3 PRODUCT LAUNCH/PRODUCT DEVELOPMENT/APPROVAL
  181.     7.3.1
  182.   7.4 ACQUISITION/PARTNERSHIP
  183.     7.4.1

US Food, Beverages & Nutrition Market Segmentation

Food, Beverages & Nutrition By Type (USD Billion, 2025-2035)

  • Liquid Filtration
  • Others

Food, Beverages & Nutrition By Media (USD Billion, 2025-2035)

  • Filter Cloth
  • Others

Food, Beverages & Nutrition By End Use (USD Billion, 2025-2035)

  • Food & Beverages
  • Chemicals
  • Petrochemicals
  • Power Generation
  • Oil & Gas
  • Rubber & Plastics
  • Bio-products
  • Pharmaceuticals
  • Metal & Mining
  • Battery Materials & Chemicals
  • Industrial Minerals
  • Pulp & Paper
  • Others

Food, Beverages & Nutrition By Product (USD Billion, 2025-2035)

  • Tower Press
  • Vacuum Belt Filters
  • Filter Press
  • Centrifuge Filter
  • LSF Filter
  • Drum Filter
  • Leaf Filter
  • Belt Presses
  • Others

Compare Licence

×
Features License Type
Single User Multiuser License Enterprise User
Price $4,950 $5,950 $7,250
Maximum User Access Limit 1 User Upto 10 Users Unrestricted Access Throughout the Organization
Free Customization
Direct Access to Analyst
Deliverable Format
Platform Access
Discount on Next Purchase 10% 15% 15%
Printable Versions