US Pharmaceutical Market Segmentation
Pharmaceutical By Product Type (USD Million, 2025-2035)
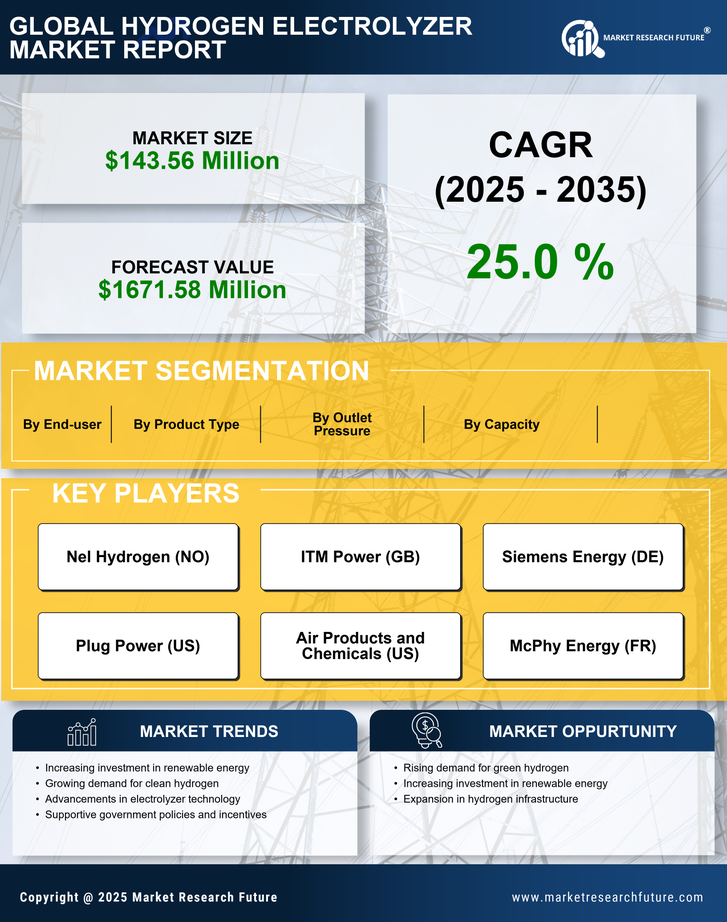
- Proton Exchange Membrane Electrolyzer
- Alkaline Electrolyzer
- Solid Oxide Electrolyzer
Pharmaceutical By Capacity (USD Million, 2025-2035)
- Low (<= 150 kW)
- Medium (150kW - 1mW)
- High (> 1mW)
Pharmaceutical By Outlet Pressure (USD Million, 2025-2035)
- Low (<= 10 Bar)
- Medium (10 Bar - 40 Bar)
- High (> 40 Bar)
Pharmaceutical By End-user (USD Million, 2025-2035)
- Ammonia
- Methanol
- Refining/ Hydrocarbon
- Electronics
- Energy
- Power to Gas
- Transport
- Metal Production and Fabrication
- Pharma and Biotech
- Food and Beverages
- Glass Industry
- Others