US Security, Access Control and Robotics Market Segmentation
Security, Access Control and Robotics By Type (USD Million, 2025-2035)
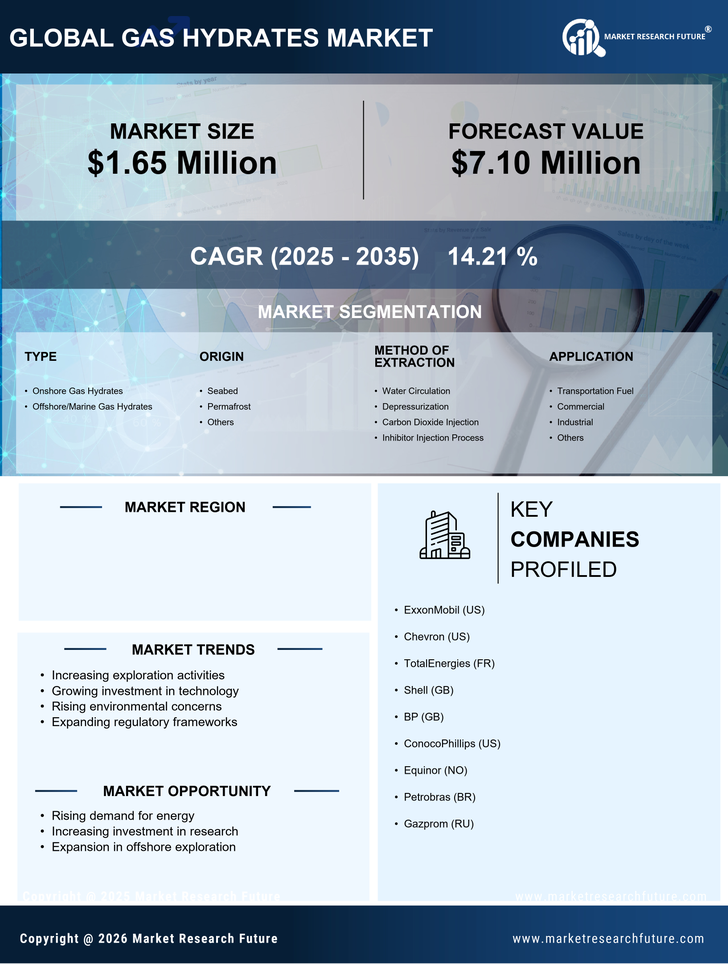
- Onshore Gas Hydrates
- Offshore/Marine Gas Hydrates
Security, Access Control and Robotics By Origin (USD Million, 2025-2035)
- Seabed
- Permafrost
- Others
Security, Access Control and Robotics By Method of Extraction (USD Million, 2025-2035)
- Water Circulation
- Depressurization
- Carbon Dioxide Injection
- Inhibitor Injection Process
Security, Access Control and Robotics By Application (USD Million, 2025-2035)
- Transportation Fuel
- Commercial
- Industrial
- Others