US US Fluoropolymer Lined Pipes Fittings Market Segmentation
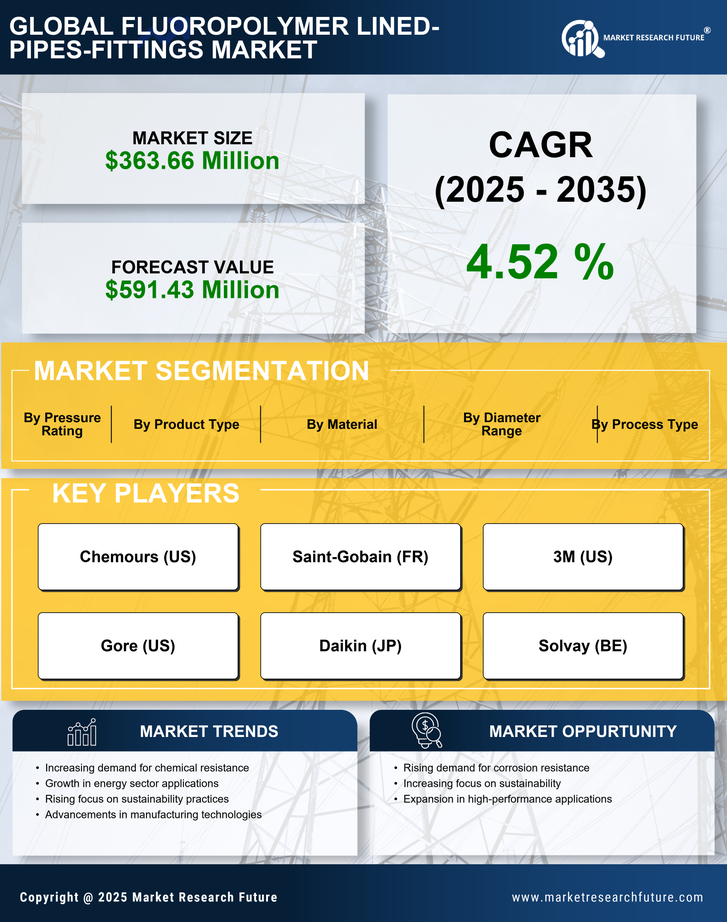
US Fluoropolymer Lined Pipes Fittings Market By Product Type (USD Million, 2025-2035)
- Lined Pipes
- Lined Fittings
US Fluoropolymer Lined Pipes Fittings Market By Diameter Range (USD Million, 2025-2035)
- Small Diameter (Less Than 2 Inches)
- Medium Diameter (2 Inches To 8 Inches)
- Large Diameter (Above 8 Inches)
US Fluoropolymer Lined Pipes Fittings Market By Material (USD Million, 2025-2035)
- Virgin PTFE
- Modified PTFE
- Expanded PTFE
US Fluoropolymer Lined Pipes Fittings Market By Pressure Rating (USD Million, 2025-2035)
- Low Pressure (Up To 150 Psi)
- Medium Pressure (150 Psi To 300 Psi)
- High Pressure (Above 300 Psi)
US Fluoropolymer Lined Pipes Fittings Market By Process Type (USD Million, 2025-2035)
- Paste Extrusion
- Ram Extrusion
- Isostatic Molding
- Compression Molding
- Others
US Fluoropolymer Lined Pipes Fittings Market By Application (USD Million, 2025-2035)
- Chemical Processing
- Pharmaceuticals
- Food & Beverage
- Water Treatment
- Oil & Gas
- Others