US Healthcare Market Segmentation
Healthcare By Type (USD Billion, 2025-2035)
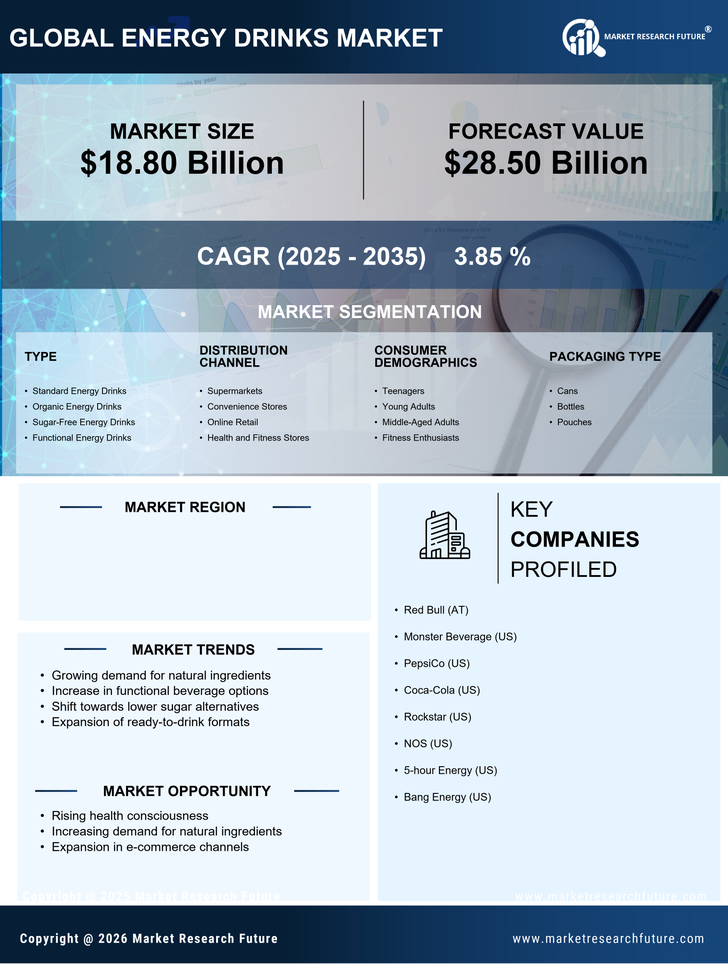
- Standard Energy Drinks
- Organic Energy Drinks
- Sugar-Free Energy Drinks
- Functional Energy Drinks
Healthcare By Distribution Channel (USD Billion, 2025-2035)
- Supermarkets
- Convenience Stores
- Online Retail
- Health and Fitness Stores
Healthcare By Consumer Demographics (USD Billion, 2025-2035)
- Teenagers
- Young Adults
- Middle-Aged Adults
- Fitness Enthusiasts
Healthcare By Packaging Type (USD Billion, 2025-2035)
- Cans
- Bottles
- Pouches