Request Free Sample ×

Kindly complete the form below to receive a free sample of this Report

* Please use a valid business email

Leading companies partner with us for data-driven Insights

clients tt-cursor
Hero Background

US Dye Stuff Market

ID: MRFR/CnM/13756-HCR
111 Pages
Chitranshi Jaiswal
Last Updated: April 06, 2026

US Dye Stuff Market Research Report: By Form (Natural, Synthetic), By Composition (Organic, Inorganic), By Process (Disperse Dye, Direct Dye, Reactive Dye, Vat Dye, Acid Dye, Others), By Types (Azo Dyes, Cyanine Dyes, Nitroso Dyes, Anthraquinone Dyes, Others) and By Application (Textile, Leather, Paper, Wood, Others) - Forecast to 2035

Share:
Download PDF ×

We do not share your information with anyone. However, we may send you emails based on your report interest from time to time. You may contact us at any time to opt-out.

US Dye Stuff Market Infographic
Purchase Options
  1. 1 SECTION I: EXECUTIVE SUMMARY AND KEY HIGHLIGHTS
  2.   1.1 EXECUTIVE SUMMARY
  3.     1.1.1 Market Overview
  4.     1.1.2 Key Findings
  5.     1.1.3 Market Segmentation
  6.     1.1.4 Competitive Landscape
  7.     1.1.5 Challenges and Opportunities
  8.     1.1.6 Future Outlook
  9. 2 SECTION II: SCOPING, METHODOLOGY AND MARKET STRUCTURE
  10.   2.1 MARKET INTRODUCTION
  11.     2.1.1 Definition
  12.     2.1.2 Scope of the study
  13.       2.1.2.1 Research Objective
  14.       2.1.2.2 Assumption
  15.       2.1.2.3 Limitations
  16.   2.2 RESEARCH METHODOLOGY
  17.     2.2.1 Overview
  18.     2.2.2 Data Mining
  19.     2.2.3 Secondary Research
  20.     2.2.4 Primary Research
  21.       2.2.4.1 Primary Interviews and Information Gathering Process
  22.       2.2.4.2 Breakdown of Primary Respondents
  23.     2.2.5 Forecasting Model
  24.     2.2.6 Market Size Estimation
  25.       2.2.6.1 Bottom-Up Approach
  26.       2.2.6.2 Top-Down Approach
  27.     2.2.7 Data Triangulation
  28.     2.2.8 Validation
  29. 3 SECTION III: QUALITATIVE ANALYSIS
  30.   3.1 MARKET DYNAMICS
  31.     3.1.1 Overview
  32.     3.1.2 Drivers
  33.     3.1.3 Restraints
  34.     3.1.4 Opportunities
  35.   3.2 MARKET FACTOR ANALYSIS
  36.     3.2.1 Value chain Analysis
  37.     3.2.2 Porter's Five Forces Analysis
  38.       3.2.2.1 Bargaining Power of Suppliers
  39.       3.2.2.2 Bargaining Power of Buyers
  40.       3.2.2.3 Threat of New Entrants
  41.       3.2.2.4 Threat of Substitutes
  42.       3.2.2.5 Intensity of Rivalry
  43.     3.2.3 COVID-19 Impact Analysis
  44.       3.2.3.1 Market Impact Analysis
  45.       3.2.3.2 Regional Impact
  46.       3.2.3.3 Opportunity and Threat Analysis
  47. 4 SECTION IV: QUANTITATIVE ANALYSIS
  48.   4.1 Pharmaceutical, BY Form (USD Million)
  49.     4.1.1 Synthetic
  50.     4.1.2 Natural
  51.   4.2 Pharmaceutical, BY Composition (USD Million)
  52.     4.2.1 Inorganic
  53.     4.2.2 Organic
  54.   4.3 Pharmaceutical, BY Process (USD Million)
  55.     4.3.1 Reactive dye
  56.     4.3.2 Disperse dye
  57.     4.3.3 Direct dye
  58.     4.3.4 Acid dye
  59.     4.3.5 Vat dye
  60.     4.3.6 Others
  61.   4.4 Pharmaceutical, BY Types (USD Million)
  62.     4.4.1 Anthraquinone dyes
  63.     4.4.2 Nitroso dyes
  64.     4.4.3 Azo dyes
  65.     4.4.4 Cyanine dyes
  66.     4.4.5 Others
  67.   4.5 Pharmaceutical, BY Application (USD Million)
  68.     4.5.1 Leather
  69.     4.5.2 Textile
  70.     4.5.3 Wood
  71.     4.5.4 Paper
  72.     4.5.5 Others
  73. 5 SECTION V: COMPETITIVE ANALYSIS
  74.   5.1 Competitive Landscape
  75.     5.1.1 Overview
  76.     5.1.2 Competitive Analysis
  77.     5.1.3 Market share Analysis
  78.     5.1.4 Major Growth Strategy in the Pharmaceutical
  79.     5.1.5 Competitive Benchmarking
  80.     5.1.6 Leading Players in Terms of Number of Developments in the Pharmaceutical
  81.     5.1.7 Key developments and growth strategies
  82.       5.1.7.1 New Product Launch/Service Deployment
  83.       5.1.7.2 Merger & Acquisitions
  84.       5.1.7.3 Joint Ventures
  85.     5.1.8 Major Players Financial Matrix
  86.       5.1.8.1 Sales and Operating Income
  87.       5.1.8.2 Major Players R&D Expenditure. 2023
  88.   5.2 Company Profiles
  89.     5.2.1 BASF SE (DE)
  90.       5.2.1.1 Financial Overview
  91.       5.2.1.2 Products Offered
  92.       5.2.1.3 Key Developments
  93.       5.2.1.4 SWOT Analysis
  94.       5.2.1.5 Key Strategies
  95.     5.2.2 Huntsman Corporation (US)
  96.       5.2.2.1 Financial Overview
  97.       5.2.2.2 Products Offered
  98.       5.2.2.3 Key Developments
  99.       5.2.2.4 SWOT Analysis
  100.       5.2.2.5 Key Strategies
  101.     5.2.3 Clariant AG (CH)
  102.       5.2.3.1 Financial Overview
  103.       5.2.3.2 Products Offered
  104.       5.2.3.3 Key Developments
  105.       5.2.3.4 SWOT Analysis
  106.       5.2.3.5 Key Strategies
  107.     5.2.4 Dystar GmbH (DE)
  108.       5.2.4.1 Financial Overview
  109.       5.2.4.2 Products Offered
  110.       5.2.4.3 Key Developments
  111.       5.2.4.4 SWOT Analysis
  112.       5.2.4.5 Key Strategies
  113.     5.2.5 Kraton Corporation (US)
  114.       5.2.5.1 Financial Overview
  115.       5.2.5.2 Products Offered
  116.       5.2.5.3 Key Developments
  117.       5.2.5.4 SWOT Analysis
  118.       5.2.5.5 Key Strategies
  119.     5.2.6 Archroma (CH)
  120.       5.2.6.1 Financial Overview
  121.       5.2.6.2 Products Offered
  122.       5.2.6.3 Key Developments
  123.       5.2.6.4 SWOT Analysis
  124.       5.2.6.5 Key Strategies
  125.     5.2.7 Lanxess AG (DE)
  126.       5.2.7.1 Financial Overview
  127.       5.2.7.2 Products Offered
  128.       5.2.7.3 Key Developments
  129.       5.2.7.4 SWOT Analysis
  130.       5.2.7.5 Key Strategies
  131.     5.2.8 Fabrica de Colorantes (MX)
  132.       5.2.8.1 Financial Overview
  133.       5.2.8.2 Products Offered
  134.       5.2.8.3 Key Developments
  135.       5.2.8.4 SWOT Analysis
  136.       5.2.8.5 Key Strategies
  137.     5.2.9 Troy Corporation (US)
  138.       5.2.9.1 Financial Overview
  139.       5.2.9.2 Products Offered
  140.       5.2.9.3 Key Developments
  141.       5.2.9.4 SWOT Analysis
  142.       5.2.9.5 Key Strategies
  143.   5.3 Appendix
  144.     5.3.1 References
  145.     5.3.2 Related Reports
  146. 6 LIST OF FIGURES
  147.   6.1 MARKET SYNOPSIS
  148.   6.2 US MARKET ANALYSIS BY FORM
  149.   6.3 US MARKET ANALYSIS BY COMPOSITION
  150.   6.4 US MARKET ANALYSIS BY PROCESS
  151.   6.5 US MARKET ANALYSIS BY TYPES
  152.   6.6 US MARKET ANALYSIS BY APPLICATION
  153.   6.7 KEY BUYING CRITERIA OF PHARMACEUTICAL
  154.   6.8 RESEARCH PROCESS OF MRFR
  155.   6.9 DRO ANALYSIS OF PHARMACEUTICAL
  156.   6.10 DRIVERS IMPACT ANALYSIS: PHARMACEUTICAL
  157.   6.11 RESTRAINTS IMPACT ANALYSIS: PHARMACEUTICAL
  158.   6.12 SUPPLY / VALUE CHAIN: PHARMACEUTICAL
  159.   6.13 PHARMACEUTICAL, BY FORM, 2024 (% SHARE)
  160.   6.14 PHARMACEUTICAL, BY FORM, 2024 TO 2035 (USD Million)
  161.   6.15 PHARMACEUTICAL, BY COMPOSITION, 2024 (% SHARE)
  162.   6.16 PHARMACEUTICAL, BY COMPOSITION, 2024 TO 2035 (USD Million)
  163.   6.17 PHARMACEUTICAL, BY PROCESS, 2024 (% SHARE)
  164.   6.18 PHARMACEUTICAL, BY PROCESS, 2024 TO 2035 (USD Million)
  165.   6.19 PHARMACEUTICAL, BY TYPES, 2024 (% SHARE)
  166.   6.20 PHARMACEUTICAL, BY TYPES, 2024 TO 2035 (USD Million)
  167.   6.21 PHARMACEUTICAL, BY APPLICATION, 2024 (% SHARE)
  168.   6.22 PHARMACEUTICAL, BY APPLICATION, 2024 TO 2035 (USD Million)
  169.   6.23 BENCHMARKING OF MAJOR COMPETITORS
  170. 7 LIST OF TABLES
  171.   7.1 LIST OF ASSUMPTIONS
  172.     7.1.1
  173.   7.2 US MARKET SIZE ESTIMATES; FORECAST
  174.     7.2.1 BY FORM, 2025-2035 (USD Million)
  175.     7.2.2 BY COMPOSITION, 2025-2035 (USD Million)
  176.     7.2.3 BY PROCESS, 2025-2035 (USD Million)
  177.     7.2.4 BY TYPES, 2025-2035 (USD Million)
  178.     7.2.5 BY APPLICATION, 2025-2035 (USD Million)
  179.   7.3 PRODUCT LAUNCH/PRODUCT DEVELOPMENT/APPROVAL
  180.     7.3.1
  181.   7.4 ACQUISITION/PARTNERSHIP
  182.     7.4.1

US Pharmaceutical Market Segmentation

Pharmaceutical By Form (USD Million, 2025-2035)
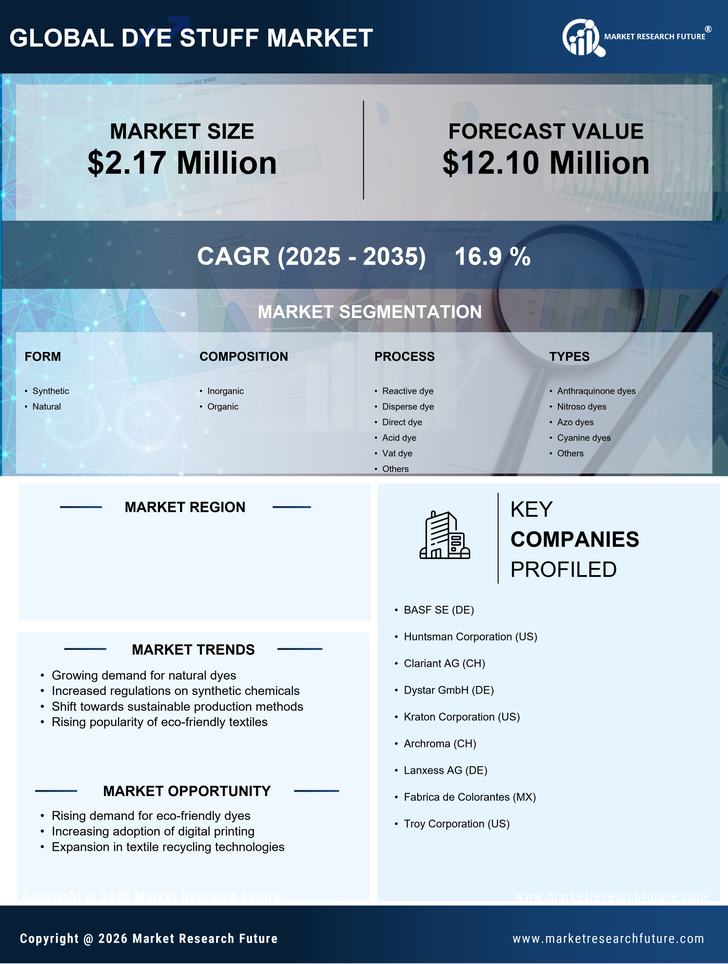
  • Synthetic
  • Natural

Pharmaceutical By Composition (USD Million, 2025-2035)

  • Inorganic
  • Organic

Pharmaceutical By Process (USD Million, 2025-2035)

  • Reactive dye
  • Disperse dye
  • Direct dye
  • Acid dye
  • Vat dye
  • Others

Pharmaceutical By Types (USD Million, 2025-2035)

  • Anthraquinone dyes
  • Nitroso dyes
  • Azo dyes
  • Cyanine dyes
  • Others

Pharmaceutical By Application (USD Million, 2025-2035)

  • Leather
  • Textile
  • Wood
  • Paper
  • Others

Compare Licence

×
Features License Type
Single User Multiuser License Enterprise User
Price $4,950 $5,950 $7,250
Maximum User Access Limit 1 User Upto 10 Users Unrestricted Access Throughout the Organization
Free Customization
Direct Access to Analyst
Deliverable Format
Platform Access
Discount on Next Purchase 10% 15% 15%
Printable Versions