Request Free Sample ×

Kindly complete the form below to receive a free sample of this Report

* Please use a valid business email

Leading companies partner with us for data-driven Insights

clients tt-cursor
Hero Background

US Crack tooth syndrome Market

ID: MRFR/MED/18364-HCR
100 Pages
Nidhi Mandole
Last Updated: April 06, 2026

US Crack Tooth Syndrome Market Research Report By Diagnosis (Clinical Examination, Dye Test, X-ray, Transillumination, Radiograph, Others), By Treatment (Stabilization, Crown Restoration, Root Canal Therapy, Extraction, Others) and By Devices (Implants, Adhesives, Expendables, Others) - Growth & Industry Forecast 2025 To 2035

Share:
Download PDF ×

We do not share your information with anyone. However, we may send you emails based on your report interest from time to time. You may contact us at any time to opt-out.

US Crack tooth syndrome Market Infographic
Purchase Options
  1. 1 SECTION I: EXECUTIVE SUMMARY AND KEY HIGHLIGHTS
  2.   1.1 EXECUTIVE SUMMARY
  3.     1.1.1 Market Overview
  4.     1.1.2 Key Findings
  5.     1.1.3 Market Segmentation
  6.     1.1.4 Competitive Landscape
  7.     1.1.5 Challenges and Opportunities
  8.     1.1.6 Future Outlook
  9. 2 SECTION II: SCOPING, METHODOLOGY AND MARKET STRUCTURE
  10.   2.1 MARKET INTRODUCTION
  11.     2.1.1 Definition
  12.     2.1.2 Scope of the study
  13.       2.1.2.1 Research Objective
  14.       2.1.2.2 Assumption
  15.       2.1.2.3 Limitations
  16.   2.2 RESEARCH METHODOLOGY
  17.     2.2.1 Overview
  18.     2.2.2 Data Mining
  19.     2.2.3 Secondary Research
  20.     2.2.4 Primary Research
  21.       2.2.4.1 Primary Interviews and Information Gathering Process
  22.       2.2.4.2 Breakdown of Primary Respondents
  23.     2.2.5 Forecasting Model
  24.     2.2.6 Market Size Estimation
  25.       2.2.6.1 Bottom-Up Approach
  26.       2.2.6.2 Top-Down Approach
  27.     2.2.7 Data Triangulation
  28.     2.2.8 Validation
  29. 3 SECTION III: QUALITATIVE ANALYSIS
  30.   3.1 MARKET DYNAMICS
  31.     3.1.1 Overview
  32.     3.1.2 Drivers
  33.     3.1.3 Restraints
  34.     3.1.4 Opportunities
  35.   3.2 MARKET FACTOR ANALYSIS
  36.     3.2.1 Value chain Analysis
  37.     3.2.2 Porter's Five Forces Analysis
  38.       3.2.2.1 Bargaining Power of Suppliers
  39.       3.2.2.2 Bargaining Power of Buyers
  40.       3.2.2.3 Threat of New Entrants
  41.       3.2.2.4 Threat of Substitutes
  42.       3.2.2.5 Intensity of Rivalry
  43.     3.2.3 COVID-19 Impact Analysis
  44.       3.2.3.1 Market Impact Analysis
  45.       3.2.3.2 Regional Impact
  46.       3.2.3.3 Opportunity and Threat Analysis
  47. 4 SECTION IV: QUANTITATIVE ANALYSIS
  48.   4.1 Life Sciences, BY Diagnosis (USD Million)
  49.     4.1.1 clinical examination
  50.     4.1.2 dye test
  51.     4.1.3 X-ray
  52.     4.1.4 transillumination
  53.     4.1.5 radiograph
  54.     4.1.6 others
  55.   4.2 Life Sciences, BY Types (USD Million)
  56.     4.2.1 completely fractured teeth
  57.     4.2.2 incompletely fractured teeth
  58.   4.3 Life Sciences, BY Drug Class (USD Million)
  59.     4.3.1 pain killers
  60.     4.3.2 anti-biotic
  61.     4.3.3 others
  62.   4.4 Life Sciences, BY Treatment (USD Million)
  63.     4.4.1 stabilization
  64.     4.4.2 crown restoration
  65.     4.4.3 root canal therapy
  66.     4.4.4 extraction
  67.     4.4.5 others
  68.   4.5 Life Sciences, BY Devices (USD Million)
  69.     4.5.1 implants
  70.     4.5.2 adhesives
  71.     4.5.3 expendables
  72.     4.5.4 others
  73. 5 SECTION V: COMPETITIVE ANALYSIS
  74.   5.1 Competitive Landscape
  75.     5.1.1 Overview
  76.     5.1.2 Competitive Analysis
  77.     5.1.3 Market share Analysis
  78.     5.1.4 Major Growth Strategy in the Life Sciences
  79.     5.1.5 Competitive Benchmarking
  80.     5.1.6 Leading Players in Terms of Number of Developments in the Life Sciences
  81.     5.1.7 Key developments and growth strategies
  82.       5.1.7.1 New Product Launch/Service Deployment
  83.       5.1.7.2 Merger & Acquisitions
  84.       5.1.7.3 Joint Ventures
  85.     5.1.8 Major Players Financial Matrix
  86.       5.1.8.1 Sales and Operating Income
  87.       5.1.8.2 Major Players R&D Expenditure. 2023
  88.   5.2 Company Profiles
  89.     5.2.1 Dentsply Sirona (US)
  90.       5.2.1.1 Financial Overview
  91.       5.2.1.2 Products Offered
  92.       5.2.1.3 Key Developments
  93.       5.2.1.4 SWOT Analysis
  94.       5.2.1.5 Key Strategies
  95.     5.2.2 Henry Schein (US)
  96.       5.2.2.1 Financial Overview
  97.       5.2.2.2 Products Offered
  98.       5.2.2.3 Key Developments
  99.       5.2.2.4 SWOT Analysis
  100.       5.2.2.5 Key Strategies
  101.     5.2.3 3M (US)
  102.       5.2.3.1 Financial Overview
  103.       5.2.3.2 Products Offered
  104.       5.2.3.3 Key Developments
  105.       5.2.3.4 SWOT Analysis
  106.       5.2.3.5 Key Strategies
  107.     5.2.4 Danaher Corporation (US)
  108.       5.2.4.1 Financial Overview
  109.       5.2.4.2 Products Offered
  110.       5.2.4.3 Key Developments
  111.       5.2.4.4 SWOT Analysis
  112.       5.2.4.5 Key Strategies
  113.     5.2.5 Coltene Holding AG (CH)
  114.       5.2.5.1 Financial Overview
  115.       5.2.5.2 Products Offered
  116.       5.2.5.3 Key Developments
  117.       5.2.5.4 SWOT Analysis
  118.       5.2.5.5 Key Strategies
  119.     5.2.6 Ivoclar Vivadent AG (LI)
  120.       5.2.6.1 Financial Overview
  121.       5.2.6.2 Products Offered
  122.       5.2.6.3 Key Developments
  123.       5.2.6.4 SWOT Analysis
  124.       5.2.6.5 Key Strategies
  125.     5.2.7 Kerr Corporation (US)
  126.       5.2.7.1 Financial Overview
  127.       5.2.7.2 Products Offered
  128.       5.2.7.3 Key Developments
  129.       5.2.7.4 SWOT Analysis
  130.       5.2.7.5 Key Strategies
  131.     5.2.8 GC Corporation (JP)
  132.       5.2.8.1 Financial Overview
  133.       5.2.8.2 Products Offered
  134.       5.2.8.3 Key Developments
  135.       5.2.8.4 SWOT Analysis
  136.       5.2.8.5 Key Strategies
  137.     5.2.9 Voco GmbH (DE)
  138.       5.2.9.1 Financial Overview
  139.       5.2.9.2 Products Offered
  140.       5.2.9.3 Key Developments
  141.       5.2.9.4 SWOT Analysis
  142.       5.2.9.5 Key Strategies
  143.   5.3 Appendix
  144.     5.3.1 References
  145.     5.3.2 Related Reports
  146. 6 LIST OF FIGURES
  147.   6.1 MARKET SYNOPSIS
  148.   6.2 US MARKET ANALYSIS BY DIAGNOSIS
  149.   6.3 US MARKET ANALYSIS BY TYPES
  150.   6.4 US MARKET ANALYSIS BY DRUG CLASS
  151.   6.5 US MARKET ANALYSIS BY TREATMENT
  152.   6.6 US MARKET ANALYSIS BY DEVICES
  153.   6.7 KEY BUYING CRITERIA OF LIFE SCIENCES
  154.   6.8 RESEARCH PROCESS OF MRFR
  155.   6.9 DRO ANALYSIS OF LIFE SCIENCES
  156.   6.10 DRIVERS IMPACT ANALYSIS: LIFE SCIENCES
  157.   6.11 RESTRAINTS IMPACT ANALYSIS: LIFE SCIENCES
  158.   6.12 SUPPLY / VALUE CHAIN: LIFE SCIENCES
  159.   6.13 LIFE SCIENCES, BY DIAGNOSIS, 2024 (% SHARE)
  160.   6.14 LIFE SCIENCES, BY DIAGNOSIS, 2024 TO 2035 (USD Million)
  161.   6.15 LIFE SCIENCES, BY TYPES, 2024 (% SHARE)
  162.   6.16 LIFE SCIENCES, BY TYPES, 2024 TO 2035 (USD Million)
  163.   6.17 LIFE SCIENCES, BY DRUG CLASS, 2024 (% SHARE)
  164.   6.18 LIFE SCIENCES, BY DRUG CLASS, 2024 TO 2035 (USD Million)
  165.   6.19 LIFE SCIENCES, BY TREATMENT, 2024 (% SHARE)
  166.   6.20 LIFE SCIENCES, BY TREATMENT, 2024 TO 2035 (USD Million)
  167.   6.21 LIFE SCIENCES, BY DEVICES, 2024 (% SHARE)
  168.   6.22 LIFE SCIENCES, BY DEVICES, 2024 TO 2035 (USD Million)
  169.   6.23 BENCHMARKING OF MAJOR COMPETITORS
  170. 7 LIST OF TABLES
  171.   7.1 LIST OF ASSUMPTIONS
  172.     7.1.1
  173.   7.2 US MARKET SIZE ESTIMATES; FORECAST
  174.     7.2.1 BY DIAGNOSIS, 2025-2035 (USD Million)
  175.     7.2.2 BY TYPES, 2025-2035 (USD Million)
  176.     7.2.3 BY DRUG CLASS, 2025-2035 (USD Million)
  177.     7.2.4 BY TREATMENT, 2025-2035 (USD Million)
  178.     7.2.5 BY DEVICES, 2025-2035 (USD Million)
  179.   7.3 PRODUCT LAUNCH/PRODUCT DEVELOPMENT/APPROVAL
  180.     7.3.1
  181.   7.4 ACQUISITION/PARTNERSHIP
  182.     7.4.1

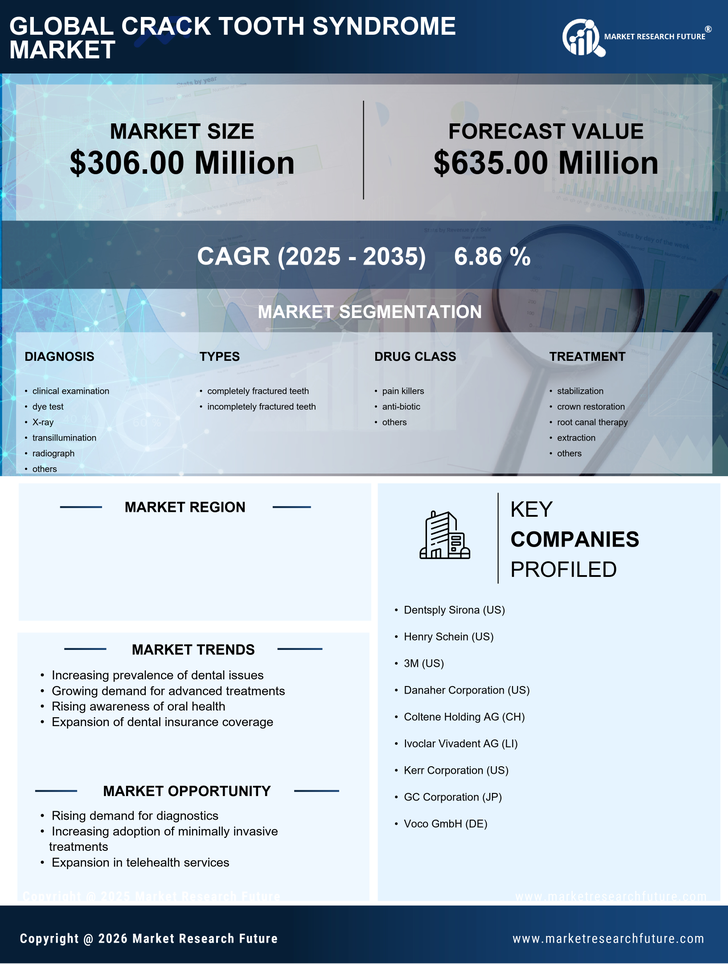
US Life Sciences Market Segmentation

Life Sciences By Diagnosis (USD Million, 2025-2035)

  • clinical examination
  • dye test
  • X-ray
  • transillumination
  • radiograph
  • others

Life Sciences By Types (USD Million, 2025-2035)

  • completely fractured teeth
  • incompletely fractured teeth

Life Sciences By Drug Class (USD Million, 2025-2035)

  • pain killers
  • anti-biotic
  • others

Life Sciences By Treatment (USD Million, 2025-2035)

  • stabilization
  • crown restoration
  • root canal therapy
  • extraction
  • others

Life Sciences By Devices (USD Million, 2025-2035)

  • implants
  • adhesives
  • expendables
  • others

Compare Licence

×
Features License Type
Single User Multiuser License Enterprise User
Price $4,950 $5,950 $7,250
Maximum User Access Limit 1 User Upto 10 Users Unrestricted Access Throughout the Organization
Free Customization
Direct Access to Analyst
Deliverable Format
Platform Access
Discount on Next Purchase 10% 15% 15%
Printable Versions