Request Free Sample ×

Kindly complete the form below to receive a free sample of this Report

* Please use a valid business email

Leading companies partner with us for data-driven Insights

clients tt-cursor
Hero Background

US Counter UAS Market

ID: MRFR/AD/19315-HCR
200 Pages
Shubham Munde
Last Updated: April 06, 2026

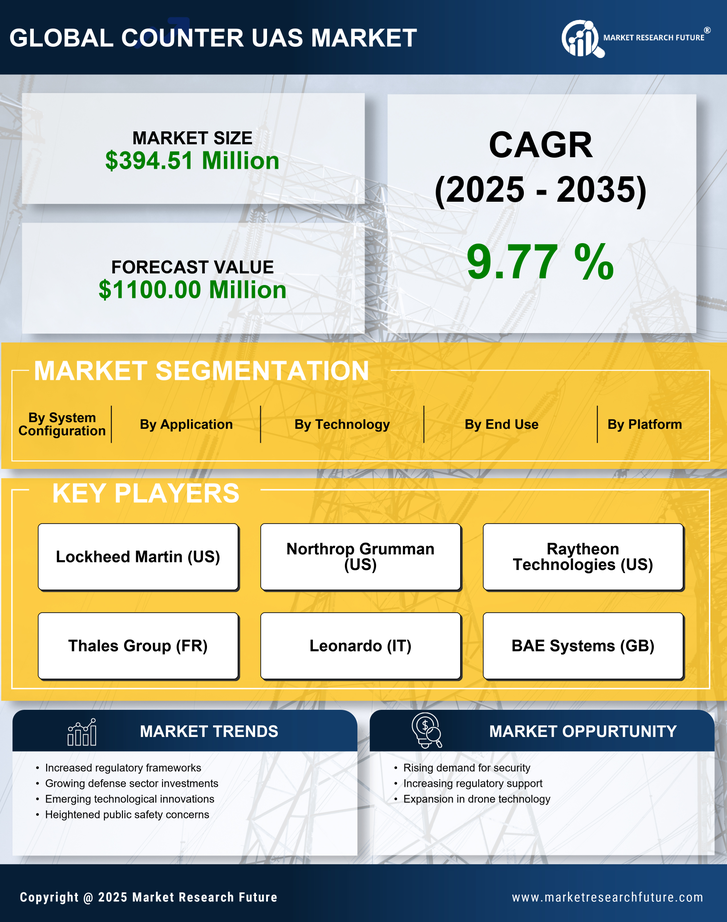
US Counter UAS Market Size, Share, Industry Trend & Analysis Research Report: By Application (Detection, Interdiction), By Product Type (Radar, RF Scanners, EO/IR, Acoustic System, Combined Sensors, Jammers, Spoofing, Laser, Nets), By End Use (Military & Defense, Commercial, Homeland Security), By Technology (Laser System, Kinetic System, Electronic System), By System Configuration (Portable, Vehicle Mounted, Standalone), By Platform (Air, Ground, Naval) andBy Purpose (Base Protection, Complimenting Existing Weapons, Airport Airspace Protection, VIP Protection, Counter-Smuggling Operations, Others)- Forecast to 2035

Share:
Download PDF ×

We do not share your information with anyone. However, we may send you emails based on your report interest from time to time. You may contact us at any time to opt-out.

US Counter UAS Market Infographic
Purchase Options
  1. 1 SECTION I: EXECUTIVE SUMMARY AND KEY HIGHLIGHTS
    1. 1.1 EXECUTIVE SUMMARY
      1. 1.1.1 Market Overview
      2. 1.1.2 Key Findings
      3. 1.1.3 Market Segmentation
      4. 1.1.4 Competitive Landscape
      5. 1.1.5 Challenges and Opportunities
      6. 1.1.6 Future Outlook
  2. 2 SECTION II: SCOPING, METHODOLOGY AND MARKET STRUCTURE
    1. 2.1 MARKET INTRODUCTION
      1. 2.1.1 Definition
      2. 2.1.2 Scope of the study
        1. 2.1.2.1 Research Objective
        2. 2.1.2.2 Assumption
        3. 2.1.2.3 Limitations
    2. 2.2 RESEARCH METHODOLOGY
      1. 2.2.1 Overview
      2. 2.2.2 Data Mining
      3. 2.2.3 Secondary Research
      4. 2.2.4 Primary Research
        1. 2.2.4.1 Primary Interviews and Information Gathering Process
        2. 2.2.4.2 Breakdown of Primary Respondents
      5. 2.2.5 Forecasting Model
      6. 2.2.6 Market Size Estimation
        1. 2.2.6.1 Bottom-Up Approach
        2. 2.2.6.2 Top-Down Approach
      7. 2.2.7 Data Triangulation
      8. 2.2.8 Validation
  3. 3 SECTION III: QUALITATIVE ANALYSIS
    1. 3.1 MARKET DYNAMICS
      1. 3.1.1 Overview
      2. 3.1.2 Drivers
      3. 3.1.3 Restraints
      4. 3.1.4 Opportunities
    2. 3.2 MARKET FACTOR ANALYSIS
      1. 3.2.1 Value chain Analysis
      2. 3.2.2 Porter's Five Forces Analysis
        1. 3.2.2.1 Bargaining Power of Suppliers
        2. 3.2.2.2 Bargaining Power of Buyers
        3. 3.2.2.3 Threat of New Entrants
        4. 3.2.2.4 Threat of Substitutes
        5. 3.2.2.5 Intensity of Rivalry
      3. 3.2.3 COVID-19 Impact Analysis
        1. 3.2.3.1 Market Impact Analysis
        2. 3.2.3.2 Regional Impact
        3. 3.2.3.3 Opportunity and Threat Analysis
  4. 4 SECTION IV: QUANTITATIVE ANALYSIS
    1. 4.1 Life Sciences, BY Application (USD Million)
      1. 4.1.1 Detection
      2. 4.1.2 Interdiction
    2. 4.2 Life Sciences, BY End Use (USD Million)
      1. 4.2.1 Military & Defense
      2. 4.2.2 Commercial
      3. 4.2.3 Homeland Security
    3. 4.3 Life Sciences, BY Technology (USD Million)
      1. 4.3.1 Laser System
      2. 4.3.2 Kinetic System
      3. 4.3.3 Electronic System
    4. 4.4 Life Sciences, BY System Configuration (USD Million)
      1. 4.4.1 Portable
      2. 4.4.2 Vehicle Mounted
      3. 4.4.3 Standalone
    5. 4.5 Life Sciences, BY Platform (USD Million)
      1. 4.5.1 Air
      2. 4.5.2 Ground
      3. 4.5.3 Naval
    6. 4.6 Life Sciences, BY Purpose (USD Million)
      1. 4.6.1 Base Protection
      2. 4.6.2 Complimenting Existing Weapons
      3. 4.6.3 Airport Airspace Protection
      4. 4.6.4 VIP Protection
      5. 4.6.5 Counter-Smuggling Operations
  5. 5 SECTION V: COMPETITIVE ANALYSIS
    1. 5.1 Competitive Landscape
      1. 5.1.1 Overview
      2. 5.1.2 Competitive Analysis
      3. 5.1.3 Market share Analysis
      4. 5.1.4 Major Growth Strategy in the Life Sciences
      5. 5.1.5 Competitive Benchmarking
      6. 5.1.6 Leading Players in Terms of Number of Developments in the Life Sciences
      7. 5.1.7 Key developments and growth strategies
        1. 5.1.7.1 New Product Launch/Service Deployment
        2. 5.1.7.2 Merger & Acquisitions
        3. 5.1.7.3 Joint Ventures
      8. 5.1.8 Major Players Financial Matrix
        1. 5.1.8.1 Sales and Operating Income
        2. 5.1.8.2 Major Players R&D Expenditure. 2023
    2. 5.2 Company Profiles
      1. 5.2.1 Lockheed Martin (US)
        1. 5.2.1.1 Financial Overview
        2. 5.2.1.2 Products Offered
        3. 5.2.1.3 Key Developments
        4. 5.2.1.4 SWOT Analysis
        5. 5.2.1.5 Key Strategies
      2. 5.2.2 Northrop Grumman (US)
        1. 5.2.2.1 Financial Overview
        2. 5.2.2.2 Products Offered
        3. 5.2.2.3 Key Developments
        4. 5.2.2.4 SWOT Analysis
        5. 5.2.2.5 Key Strategies
      3. 5.2.3 Raytheon Technologies (US)
        1. 5.2.3.1 Financial Overview
        2. 5.2.3.2 Products Offered
        3. 5.2.3.3 Key Developments
        4. 5.2.3.4 SWOT Analysis
        5. 5.2.3.5 Key Strategies
      4. 5.2.4 Thales Group (FR)
        1. 5.2.4.1 Financial Overview
        2. 5.2.4.2 Products Offered
        3. 5.2.4.3 Key Developments
        4. 5.2.4.4 SWOT Analysis
        5. 5.2.4.5 Key Strategies
      5. 5.2.5 Leonardo (IT)
        1. 5.2.5.1 Financial Overview
        2. 5.2.5.2 Products Offered
        3. 5.2.5.3 Key Developments
        4. 5.2.5.4 SWOT Analysis
        5. 5.2.5.5 Key Strategies
      6. 5.2.6 BAE Systems (GB)
        1. 5.2.6.1 Financial Overview
        2. 5.2.6.2 Products Offered
        3. 5.2.6.3 Key Developments
        4. 5.2.6.4 SWOT Analysis
        5. 5.2.6.5 Key Strategies
      7. 5.2.7 DroneShield (AU)
        1. 5.2.7.1 Financial Overview
        2. 5.2.7.2 Products Offered
        3. 5.2.7.3 Key Developments
        4. 5.2.7.4 SWOT Analysis
        5. 5.2.7.5 Key Strategies
      8. 5.2.8 Airbus (FR)
        1. 5.2.8.1 Financial Overview
        2. 5.2.8.2 Products Offered
        3. 5.2.8.3 Key Developments
        4. 5.2.8.4 SWOT Analysis
        5. 5.2.8.5 Key Strategies
      9. 5.2.9 Elbit Systems (IL)
        1. 5.2.9.1 Financial Overview
        2. 5.2.9.2 Products Offered
        3. 5.2.9.3 Key Developments
        4. 5.2.9.4 SWOT Analysis
        5. 5.2.9.5 Key Strategies
    3. 5.3 Appendix
      1. 5.3.1 References
      2. 5.3.2 Related Reports
  6. 6 LIST OF FIGURES
    1. 6.1 MARKET SYNOPSIS
    2. 6.2 US MARKET ANALYSIS BY APPLICATION
    3. 6.3 US MARKET ANALYSIS BY END USE
    4. 6.4 US MARKET ANALYSIS BY TECHNOLOGY
    5. 6.5 US MARKET ANALYSIS BY SYSTEM CONFIGURATION
    6. 6.6 US MARKET ANALYSIS BY PLATFORM
    7. 6.7 US MARKET ANALYSIS BY PURPOSE
    8. 6.8 KEY BUYING CRITERIA OF LIFE SCIENCES
    9. 6.9 RESEARCH PROCESS OF MRFR
    10. 6.10 DRO ANALYSIS OF LIFE SCIENCES
    11. 6.11 DRIVERS IMPACT ANALYSIS: LIFE SCIENCES
    12. 6.12 RESTRAINTS IMPACT ANALYSIS: LIFE SCIENCES
    13. 6.13 SUPPLY / VALUE CHAIN: LIFE SCIENCES
    14. 6.14 LIFE SCIENCES, BY APPLICATION, 2024 (% SHARE)
    15. 6.15 LIFE SCIENCES, BY APPLICATION, 2024 TO 2035 (USD Million)
    16. 6.16 LIFE SCIENCES, BY END USE, 2024 (% SHARE)
    17. 6.17 LIFE SCIENCES, BY END USE, 2024 TO 2035 (USD Million)
    18. 6.18 LIFE SCIENCES, BY TECHNOLOGY, 2024 (% SHARE)
    19. 6.19 LIFE SCIENCES, BY TECHNOLOGY, 2024 TO 2035 (USD Million)
    20. 6.20 LIFE SCIENCES, BY SYSTEM CONFIGURATION, 2024 (% SHARE)
    21. 6.21 LIFE SCIENCES, BY SYSTEM CONFIGURATION, 2024 TO 2035 (USD Million)
    22. 6.22 LIFE SCIENCES, BY PLATFORM, 2024 (% SHARE)
    23. 6.23 LIFE SCIENCES, BY PLATFORM, 2024 TO 2035 (USD Million)
    24. 6.24 LIFE SCIENCES, BY PURPOSE, 2024 (% SHARE)
    25. 6.25 LIFE SCIENCES, BY PURPOSE, 2024 TO 2035 (USD Million)
    26. 6.26 BENCHMARKING OF MAJOR COMPETITORS
  7. 7 LIST OF TABLES
    1. 7.1 LIST OF ASSUMPTIONS
  8. 7.1.1
    1. 7.2 US MARKET SIZE ESTIMATES; FORECAST
      1. 7.2.1 BY APPLICATION, 2025-2035 (USD Million)
      2. 7.2.2 BY END USE, 2025-2035 (USD Million)
      3. 7.2.3 BY TECHNOLOGY, 2025-2035 (USD Million)
      4. 7.2.4 BY SYSTEM CONFIGURATION, 2025-2035 (USD Million)
      5. 7.2.5 BY PLATFORM, 2025-2035 (USD Million)
      6. 7.2.6 BY PURPOSE, 2025-2035 (USD Million)
    2. 7.3 PRODUCT LAUNCH/PRODUCT DEVELOPMENT/APPROVAL
  9. 7.3.1
    1. 7.4 ACQUISITION/PARTNERSHIP
  10. 7.4.1

US Life Sciences Market Segmentation

Life Sciences By Application (USD Million, 2025-2035)

  • Detection
  • Interdiction

Life Sciences By End Use (USD Million, 2025-2035)

  • Military & Defense
  • Commercial
  • Homeland Security

Life Sciences By Technology (USD Million, 2025-2035)

  • Laser System
  • Kinetic System
  • Electronic System

Life Sciences By System Configuration (USD Million, 2025-2035)

  • Portable
  • Vehicle Mounted
  • Standalone

Life Sciences By Platform (USD Million, 2025-2035)

  • Air
  • Ground
  • Naval

Life Sciences By Purpose (USD Million, 2025-2035)

  • Base Protection
  • Complimenting Existing Weapons
  • Airport Airspace Protection
  • VIP Protection
  • Counter-Smuggling Operations

Compare Licence

×
Features License Type
Single User Multiuser License Enterprise User
Price $4,950 $5,950 $7,250
Maximum User Access Limit 1 User Upto 10 Users Unrestricted Access Throughout the Organization
Free Customization
Direct Access to Analyst
Deliverable Format
Platform Access
Discount on Next Purchase 10% 15% 15%
Printable Versions