

US Chemicals and Materials Market Segmentation
Chemicals and Materials By Component (USD Billion, 2025-2035)
- Solution
- Service
Chemicals and Materials By Application (USD Billion, 2025-2035)
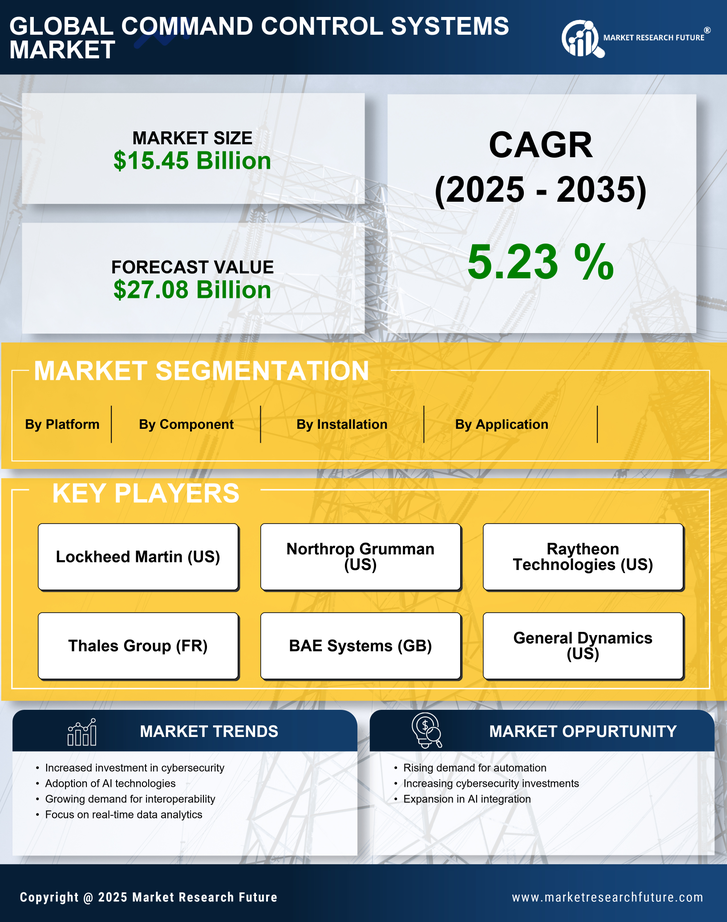
- Government & Defense
- Commercial
Chemicals and Materials By Installation (USD Billion, 2025-2035)
- Deployable Command Centers
- Fixed Command Centers
Chemicals and Materials By Platform (USD Billion, 2025-2035)
- Land
- Space
- Airborne
- Maritime


