US Clinical Laboratory Services Market Segmentation
US Clinical Laboratory Services Market By Test Type (USD Billion, 2025-2035)
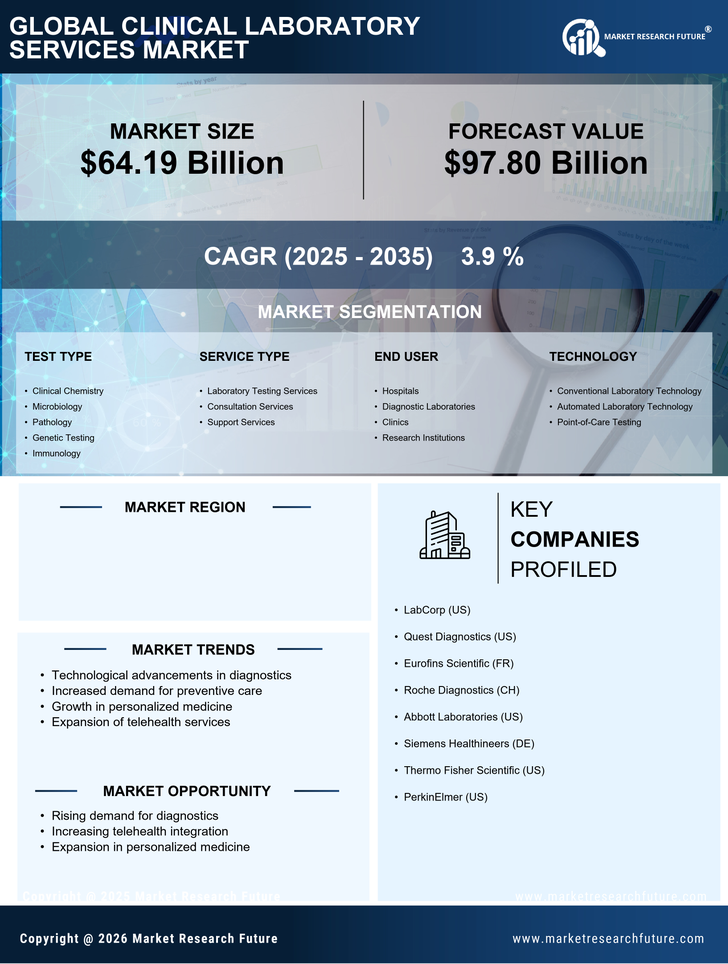
- Clinical Chemistry
- Microbiology
- Pathology
- Genetic Testing
- Immunology
US Clinical Laboratory Services Market By Service Type (USD Billion, 2025-2035)
- Laboratory Testing Services
- Consultation Services
- Support Services
US Clinical Laboratory Services Market By End User (USD Billion, 2025-2035)
- Hospitals
- Diagnostic Laboratories
- Clinics
- Research Institutions
US Clinical Laboratory Services Market By Technology (USD Billion, 2025-2035)
- Conventional Laboratory Technology
- Automated Laboratory Technology
- Point-of-Care Testing