US US Bio-based surfactants Market Segmentation
US Bio-based surfactants Market By Application (USD Billion, 2025-2035)
- Household Cleaning
- Personal Care
- Industrial Cleaning
- Agricultural
- Food Processing
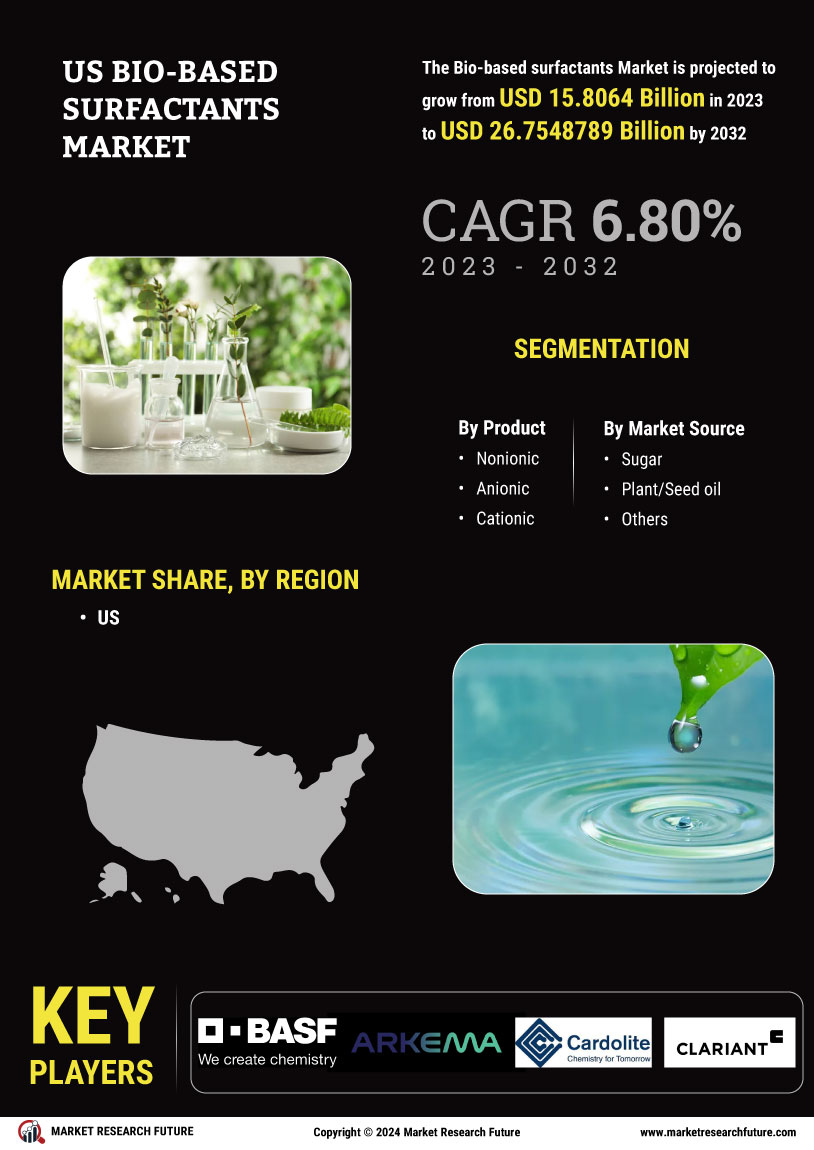
US Bio-based surfactants Market By Type (USD Billion, 2025-2035)
- Anionic Surfactants
- Cationic Surfactants
- Nonionic Surfactants
- Amphoteric Surfactants
US Bio-based surfactants Market By Source (USD Billion, 2025-2035)
- Plant-Based
- Animal-Based
- Microbial-Based
US Bio-based surfactants Market By End Use (USD Billion, 2025-2035)
- Cosmetics
- Detergents
- Textiles
- Food and Beverage
- Pharmaceuticals