US Bike Scooter Rental Market

ID: MRFR/AT/15110-HCR
100 Pages
Shubham Munde
Last Updated: April 06, 2026
US Bike Scooter Rental Market Research Report By Service (Pay as You Go, Subscription-Based), By Propulsion (Pedal, Electric, Gasoline), By Operational Model (Dock Less, Station-Based), By Vehicle (Bike, Scooter, Others) and By Application (Short Trip, Medium Trip, Long Trip) - Forecast to 2035
Download PDF ×

We do not share your information with anyone. However, we may send you emails based on your report interest from time to time. You may contact us at any time to opt-out.

  1. 1 SECTION I: EXECUTIVE SUMMARY AND KEY HIGHLIGHTS
    1. 1.1 EXECUTIVE SUMMARY
      1. 1.1.1 Market Overview
      2. 1.1.2 Key Findings
      3. 1.1.3 Market Segmentation
      4. 1.1.4 Competitive Landscape
      5. 1.1.5 Challenges and Opportunities
      6. 1.1.6 Future Outlook
  2. 2 SECTION II: SCOPING, METHODOLOGY AND MARKET STRUCTURE
    1. 2.1 MARKET INTRODUCTION
      1. 2.1.1 Definition
      2. 2.1.2 Scope of the study
        1. 2.1.2.1 Research Objective
        2. 2.1.2.2 Assumption
        3. 2.1.2.3 Limitations
    2. 2.2 RESEARCH METHODOLOGY
      1. 2.2.1 Overview
      2. 2.2.2 Data Mining
      3. 2.2.3 Secondary Research
      4. 2.2.4 Primary Research
        1. 2.2.4.1 Primary Interviews and Information Gathering Process
        2. 2.2.4.2 Breakdown of Primary Respondents
      5. 2.2.5 Forecasting Model
      6. 2.2.6 Market Size Estimation
        1. 2.2.6.1 Bottom-Up Approach
        2. 2.2.6.2 Top-Down Approach
      7. 2.2.7 Data Triangulation
      8. 2.2.8 Validation
  3. 3 SECTION III: QUALITATIVE ANALYSIS
    1. 3.1 MARKET DYNAMICS
      1. 3.1.1 Overview
      2. 3.1.2 Drivers
      3. 3.1.3 Restraints
      4. 3.1.4 Opportunities
    2. 3.2 MARKET FACTOR ANALYSIS
      1. 3.2.1 Value chain Analysis
      2. 3.2.2 Porter's Five Forces Analysis
        1. 3.2.2.1 Bargaining Power of Suppliers
        2. 3.2.2.2 Bargaining Power of Buyers
        3. 3.2.2.3 Threat of New Entrants
        4. 3.2.2.4 Threat of Substitutes
        5. 3.2.2.5 Intensity of Rivalry
      3. 3.2.3 COVID-19 Impact Analysis
        1. 3.2.3.1 Market Impact Analysis
        2. 3.2.3.2 Regional Impact
        3. 3.2.3.3 Opportunity and Threat Analysis
  4. 4 SECTION IV: QUANTITATIVE ANALYSIS
    1. 4.1 Automobile, BY Service (USD Million)
      1. 4.1.1 Pay as You Go
      2. 4.1.2 Subscription-Based
    2. 4.2 Automobile, BY Propulsion (USD Million)
      1. 4.2.1 Pedal
      2. 4.2.2 Electric
      3. 4.2.3 Gasoline
    3. 4.3 Automobile, BY Operational Model (USD Million)
      1. 4.3.1 Dock Less
      2. 4.3.2 Station-Based
    4. 4.4 Automobile, BY Vehicle (USD Million)
      1. 4.4.1 Bike
      2. 4.4.2 Scooter
      3. 4.4.3 Others
    5. 4.5 Automobile, BY Application (USD Million)
      1. 4.5.1 Short Trip (Less Than 5 km)
      2. 4.5.2 Medium Trip (5 km to 15 km)
      3. 4.5.3 Long Trip (More Than 15 km)
  5. 5 SECTION V: COMPETITIVE ANALYSIS
    1. 5.1 Competitive Landscape
      1. 5.1.1 Overview
      2. 5.1.2 Competitive Analysis
      3. 5.1.3 Market share Analysis
      4. 5.1.4 Major Growth Strategy in the Automobile
      5. 5.1.5 Competitive Benchmarking
      6. 5.1.6 Leading Players in Terms of Number of Developments in the Automobile
      7. 5.1.7 Key developments and growth strategies
        1. 5.1.7.1 New Product Launch/Service Deployment
        2. 5.1.7.2 Merger & Acquisitions
        3. 5.1.7.3 Joint Ventures
      8. 5.1.8 Major Players Financial Matrix
        1. 5.1.8.1 Sales and Operating Income
        2. 5.1.8.2 Major Players R&D Expenditure. 2023
    2. 5.2 Company Profiles
      1. 5.2.1 Lime (US)
        1. 5.2.1.1 Financial Overview
        2. 5.2.1.2 Products Offered
        3. 5.2.1.3 Key Developments
        4. 5.2.1.4 SWOT Analysis
        5. 5.2.1.5 Key Strategies
      2. 5.2.2 Bird (US)
        1. 5.2.2.1 Financial Overview
        2. 5.2.2.2 Products Offered
        3. 5.2.2.3 Key Developments
        4. 5.2.2.4 SWOT Analysis
        5. 5.2.2.5 Key Strategies
      3. 5.2.3 Spin (US)
        1. 5.2.3.1 Financial Overview
        2. 5.2.3.2 Products Offered
        3. 5.2.3.3 Key Developments
        4. 5.2.3.4 SWOT Analysis
        5. 5.2.3.5 Key Strategies
      4. 5.2.4 Voi (SE)
        1. 5.2.4.1 Financial Overview
        2. 5.2.4.2 Products Offered
        3. 5.2.4.3 Key Developments
        4. 5.2.4.4 SWOT Analysis
        5. 5.2.4.5 Key Strategies
      5. 5.2.5 Tier (DE)
        1. 5.2.5.1 Financial Overview
        2. 5.2.5.2 Products Offered
        3. 5.2.5.3 Key Developments
        4. 5.2.5.4 SWOT Analysis
        5. 5.2.5.5 Key Strategies
      6. 5.2.6 Dott (NL)
        1. 5.2.6.1 Financial Overview
        2. 5.2.6.2 Products Offered
        3. 5.2.6.3 Key Developments
        4. 5.2.6.4 SWOT Analysis
        5. 5.2.6.5 Key Strategies
      7. 5.2.7 Circ (DE)
        1. 5.2.7.1 Financial Overview
        2. 5.2.7.2 Products Offered
        3. 5.2.7.3 Key Developments
        4. 5.2.7.4 SWOT Analysis
        5. 5.2.7.5 Key Strategies
      8. 5.2.8 Bolt (EE)
        1. 5.2.8.1 Financial Overview
        2. 5.2.8.2 Products Offered
        3. 5.2.8.3 Key Developments
        4. 5.2.8.4 SWOT Analysis
        5. 5.2.8.5 Key Strategies
    3. 5.3 Appendix
      1. 5.3.1 References
      2. 5.3.2 Related Reports
  6. 6 LIST OF FIGURES
    1. 6.1 MARKET SYNOPSIS
    2. 6.2 US MARKET ANALYSIS BY SERVICE
    3. 6.3 US MARKET ANALYSIS BY PROPULSION
    4. 6.4 US MARKET ANALYSIS BY OPERATIONAL MODEL
    5. 6.5 US MARKET ANALYSIS BY VEHICLE
    6. 6.6 US MARKET ANALYSIS BY APPLICATION
    7. 6.7 KEY BUYING CRITERIA OF AUTOMOBILE
    8. 6.8 RESEARCH PROCESS OF MRFR
    9. 6.9 DRO ANALYSIS OF AUTOMOBILE
    10. 6.10 DRIVERS IMPACT ANALYSIS: AUTOMOBILE
    11. 6.11 RESTRAINTS IMPACT ANALYSIS: AUTOMOBILE
    12. 6.12 SUPPLY / VALUE CHAIN: AUTOMOBILE
    13. 6.13 AUTOMOBILE, BY SERVICE, 2024 (% SHARE)
    14. 6.14 AUTOMOBILE, BY SERVICE, 2024 TO 2035 (USD Million)
    15. 6.15 AUTOMOBILE, BY PROPULSION, 2024 (% SHARE)
    16. 6.16 AUTOMOBILE, BY PROPULSION, 2024 TO 2035 (USD Million)
    17. 6.17 AUTOMOBILE, BY OPERATIONAL MODEL, 2024 (% SHARE)
    18. 6.18 AUTOMOBILE, BY OPERATIONAL MODEL, 2024 TO 2035 (USD Million)
    19. 6.19 AUTOMOBILE, BY VEHICLE, 2024 (% SHARE)
    20. 6.20 AUTOMOBILE, BY VEHICLE, 2024 TO 2035 (USD Million)
    21. 6.21 AUTOMOBILE, BY APPLICATION, 2024 (% SHARE)
    22. 6.22 AUTOMOBILE, BY APPLICATION, 2024 TO 2035 (USD Million)
    23. 6.23 BENCHMARKING OF MAJOR COMPETITORS
  7. 7 LIST OF TABLES
    1. 7.1 LIST OF ASSUMPTIONS
  8. 7.1.1
    1. 7.2 US MARKET SIZE ESTIMATES; FORECAST
      1. 7.2.1 BY SERVICE, 2025-2035 (USD Million)
      2. 7.2.2 BY PROPULSION, 2025-2035 (USD Million)
      3. 7.2.3 BY OPERATIONAL MODEL, 2025-2035 (USD Million)
      4. 7.2.4 BY VEHICLE, 2025-2035 (USD Million)
      5. 7.2.5 BY APPLICATION, 2025-2035 (USD Million)
    2. 7.3 PRODUCT LAUNCH/PRODUCT DEVELOPMENT/APPROVAL
  9. 7.3.1
    1. 7.4 ACQUISITION/PARTNERSHIP
  10. 7.4.1

US Automobile Market Segmentation

Automobile By Service (USD Million, 2025-2035)
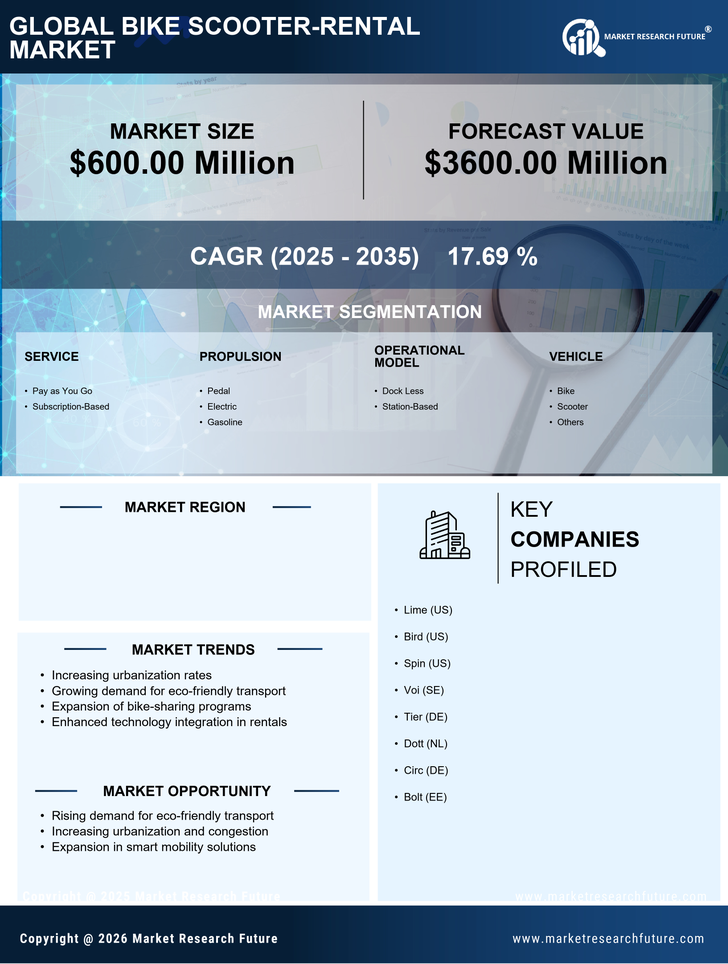
  • Pay as You Go
  • Subscription-Based

Automobile By Propulsion (USD Million, 2025-2035)

  • Pedal
  • Electric
  • Gasoline

Automobile By Operational Model (USD Million, 2025-2035)

  • Dock Less
  • Station-Based

Automobile By Vehicle (USD Million, 2025-2035)

  • Bike
  • Scooter
  • Others

Automobile By Application (USD Million, 2025-2035)

  • Short Trip (Less Than 5 km)
  • Medium Trip (5 km to 15 km)
  • Long Trip (More Than 15 km)