Request Free Sample ×

Kindly complete the form below to receive a free sample of this Report

* Please use a valid business email

Leading companies partner with us for data-driven Insights

clients tt-cursor
Hero Background

US Bakery Filling Toppings Market

ID: MRFR/FnB/12037-CR
100 Pages
Garvit Vyas
Last Updated: January 13, 2026

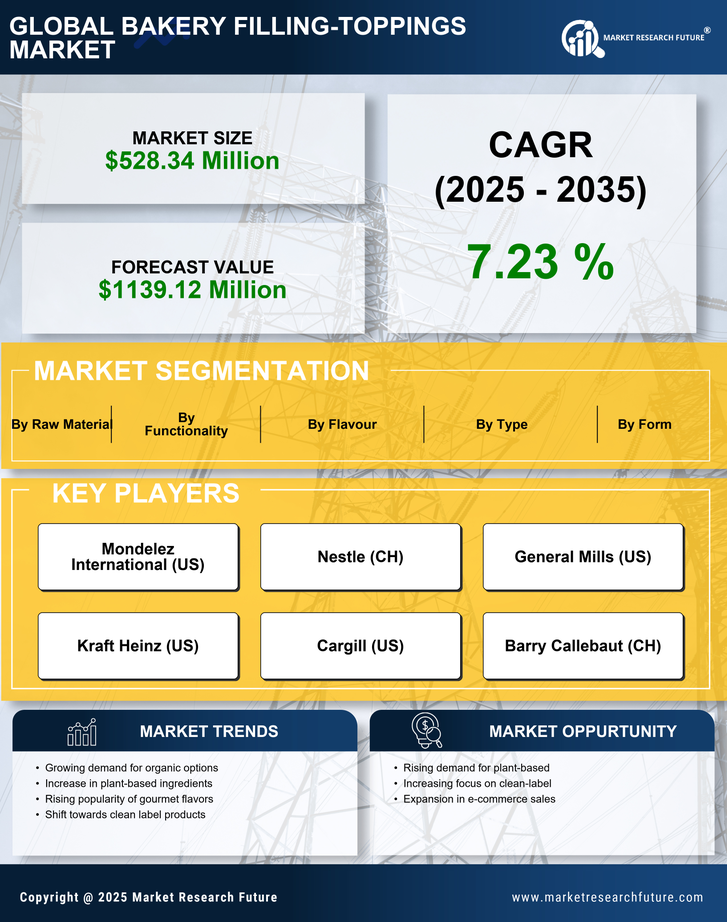
US Bakery Filling Toppings Market Size, Share, Industry Trend & Analysis Research Report: By Form (Solid, Liquid, Gel, Foam), By Type (Syrups, Pastes and Variegates, Creams, Fruit and Nuts, Sprinkles), By Flavour (Fruit, Chocolate, Vanilla, Nut, Caramel, Other Flavours), By Raw Material (Sweetener, Fruit, Cocoa, Dairy Ingredients, Texturizers, Others), and By Functionality (Glazing, Stabilizing, Viscosity, Flavour Enhancing, Texturizing) - Forecast to 2035

Share:
Download PDF ×

We do not share your information with anyone. However, we may send you emails based on your report interest from time to time. You may contact us at any time to opt-out.

US Bakery Filling Toppings Market Infographic
Purchase Options
  1. 1 SECTION I: EXECUTIVE SUMMARY AND KEY HIGHLIGHTS
  2.   1.1 EXECUTIVE SUMMARY
  3.     1.1.1 Market Overview
  4.     1.1.2 Key Findings
  5.     1.1.3 Market Segmentation
  6.     1.1.4 Competitive Landscape
  7.     1.1.5 Challenges and Opportunities
  8.     1.1.6 Future Outlook
  9. 2 SECTION II: SCOPING, METHODOLOGY AND MARKET STRUCTURE
  10.   2.1 MARKET INTRODUCTION
  11.     2.1.1 Definition
  12.     2.1.2 Scope of the study
  13.       2.1.2.1 Research Objective
  14.       2.1.2.2 Assumption
  15.       2.1.2.3 Limitations
  16.   2.2 RESEARCH METHODOLOGY
  17.     2.2.1 Overview
  18.     2.2.2 Data Mining
  19.     2.2.3 Secondary Research
  20.     2.2.4 Primary Research
  21.       2.2.4.1 Primary Interviews and Information Gathering Process
  22.       2.2.4.2 Breakdown of Primary Respondents
  23.     2.2.5 Forecasting Model
  24.     2.2.6 Market Size Estimation
  25.       2.2.6.1 Bottom-Up Approach
  26.       2.2.6.2 Top-Down Approach
  27.     2.2.7 Data Triangulation
  28.     2.2.8 Validation
  29. 3 SECTION III: QUALITATIVE ANALYSIS
  30.   3.1 MARKET DYNAMICS
  31.     3.1.1 Overview
  32.     3.1.2 Drivers
  33.     3.1.3 Restraints
  34.     3.1.4 Opportunities
  35.   3.2 MARKET FACTOR ANALYSIS
  36.     3.2.1 Value chain Analysis
  37.     3.2.2 Porter's Five Forces Analysis
  38.       3.2.2.1 Bargaining Power of Suppliers
  39.       3.2.2.2 Bargaining Power of Buyers
  40.       3.2.2.3 Threat of New Entrants
  41.       3.2.2.4 Threat of Substitutes
  42.       3.2.2.5 Intensity of Rivalry
  43.     3.2.3 COVID-19 Impact Analysis
  44.       3.2.3.1 Market Impact Analysis
  45.       3.2.3.2 Regional Impact
  46.       3.2.3.3 Opportunity and Threat Analysis
  47. 4 SECTION IV: QUANTITATIVE ANALYSIS
  48.   4.1 Construction, BY Functionality (USD Million)
  49.     4.1.1 Glazing
  50.     4.1.2 Stabilizing
  51.     4.1.3 Viscosity
  52.     4.1.4 Flavour Enhancing
  53.     4.1.5 Texturizing
  54.   4.2 Construction, BY Type (USD Million)
  55.     4.2.1 Syrups
  56.     4.2.2 Pastes and Variegates
  57.     4.2.3 Creams
  58.     4.2.4 Fruit and Nuts
  59.     4.2.5 Sprinkles
  60.   4.3 Construction, BY Flavour (USD Million)
  61.     4.3.1 Fruit
  62.     4.3.2 Chocolate
  63.     4.3.3 Vanilla
  64.     4.3.4 Nut
  65.     4.3.5 Caramel
  66.     4.3.6 Other Flavours
  67.   4.4 Construction, BY Raw Material (USD Million)
  68.     4.4.1 Sweetener
  69.     4.4.2 Fruit
  70.     4.4.3 Cocoa
  71.     4.4.4 Dairy Ingredients
  72.     4.4.5 Texturizers
  73.     4.4.6 Others
  74.   4.5 Construction, BY Form (USD Million)
  75.     4.5.1 Solid
  76.     4.5.2 Liquid
  77.     4.5.3 Gel
  78.     4.5.4 Foam
  79. 5 SECTION V: COMPETITIVE ANALYSIS
  80.   5.1 Competitive Landscape
  81.     5.1.1 Overview
  82.     5.1.2 Competitive Analysis
  83.     5.1.3 Market share Analysis
  84.     5.1.4 Major Growth Strategy in the Construction
  85.     5.1.5 Competitive Benchmarking
  86.     5.1.6 Leading Players in Terms of Number of Developments in the Construction
  87.     5.1.7 Key developments and growth strategies
  88.       5.1.7.1 New Product Launch/Service Deployment
  89.       5.1.7.2 Merger & Acquisitions
  90.       5.1.7.3 Joint Ventures
  91.     5.1.8 Major Players Financial Matrix
  92.       5.1.8.1 Sales and Operating Income
  93.       5.1.8.2 Major Players R&D Expenditure. 2023
  94.   5.2 Company Profiles
  95.     5.2.1 Mondelez International (US)
  96.       5.2.1.1 Financial Overview
  97.       5.2.1.2 Products Offered
  98.       5.2.1.3 Key Developments
  99.       5.2.1.4 SWOT Analysis
  100.       5.2.1.5 Key Strategies
  101.     5.2.2 Nestle (CH)
  102.       5.2.2.1 Financial Overview
  103.       5.2.2.2 Products Offered
  104.       5.2.2.3 Key Developments
  105.       5.2.2.4 SWOT Analysis
  106.       5.2.2.5 Key Strategies
  107.     5.2.3 General Mills (US)
  108.       5.2.3.1 Financial Overview
  109.       5.2.3.2 Products Offered
  110.       5.2.3.3 Key Developments
  111.       5.2.3.4 SWOT Analysis
  112.       5.2.3.5 Key Strategies
  113.     5.2.4 Kraft Heinz (US)
  114.       5.2.4.1 Financial Overview
  115.       5.2.4.2 Products Offered
  116.       5.2.4.3 Key Developments
  117.       5.2.4.4 SWOT Analysis
  118.       5.2.4.5 Key Strategies
  119.     5.2.5 Cargill (US)
  120.       5.2.5.1 Financial Overview
  121.       5.2.5.2 Products Offered
  122.       5.2.5.3 Key Developments
  123.       5.2.5.4 SWOT Analysis
  124.       5.2.5.5 Key Strategies
  125.     5.2.6 Barry Callebaut (CH)
  126.       5.2.6.1 Financial Overview
  127.       5.2.6.2 Products Offered
  128.       5.2.6.3 Key Developments
  129.       5.2.6.4 SWOT Analysis
  130.       5.2.6.5 Key Strategies
  131.     5.2.7 Dawn Foods (US)
  132.       5.2.7.1 Financial Overview
  133.       5.2.7.2 Products Offered
  134.       5.2.7.3 Key Developments
  135.       5.2.7.4 SWOT Analysis
  136.       5.2.7.5 Key Strategies
  137.     5.2.8 Pillsbury (US)
  138.       5.2.8.1 Financial Overview
  139.       5.2.8.2 Products Offered
  140.       5.2.8.3 Key Developments
  141.       5.2.8.4 SWOT Analysis
  142.       5.2.8.5 Key Strategies
  143.     5.2.9 Rich Products (US)
  144.       5.2.9.1 Financial Overview
  145.       5.2.9.2 Products Offered
  146.       5.2.9.3 Key Developments
  147.       5.2.9.4 SWOT Analysis
  148.       5.2.9.5 Key Strategies
  149.   5.3 Appendix
  150.     5.3.1 References
  151.     5.3.2 Related Reports
  152. 6 LIST OF FIGURES
  153.   6.1 MARKET SYNOPSIS
  154.   6.2 US MARKET ANALYSIS BY FUNCTIONALITY
  155.   6.3 US MARKET ANALYSIS BY TYPE
  156.   6.4 US MARKET ANALYSIS BY FLAVOUR
  157.   6.5 US MARKET ANALYSIS BY RAW MATERIAL
  158.   6.6 US MARKET ANALYSIS BY FORM
  159.   6.7 KEY BUYING CRITERIA OF CONSTRUCTION
  160.   6.8 RESEARCH PROCESS OF MRFR
  161.   6.9 DRO ANALYSIS OF CONSTRUCTION
  162.   6.10 DRIVERS IMPACT ANALYSIS: CONSTRUCTION
  163.   6.11 RESTRAINTS IMPACT ANALYSIS: CONSTRUCTION
  164.   6.12 SUPPLY / VALUE CHAIN: CONSTRUCTION
  165.   6.13 CONSTRUCTION, BY FUNCTIONALITY, 2024 (% SHARE)
  166.   6.14 CONSTRUCTION, BY FUNCTIONALITY, 2024 TO 2035 (USD Million)
  167.   6.15 CONSTRUCTION, BY TYPE, 2024 (% SHARE)
  168.   6.16 CONSTRUCTION, BY TYPE, 2024 TO 2035 (USD Million)
  169.   6.17 CONSTRUCTION, BY FLAVOUR, 2024 (% SHARE)
  170.   6.18 CONSTRUCTION, BY FLAVOUR, 2024 TO 2035 (USD Million)
  171.   6.19 CONSTRUCTION, BY RAW MATERIAL, 2024 (% SHARE)
  172.   6.20 CONSTRUCTION, BY RAW MATERIAL, 2024 TO 2035 (USD Million)
  173.   6.21 CONSTRUCTION, BY FORM, 2024 (% SHARE)
  174.   6.22 CONSTRUCTION, BY FORM, 2024 TO 2035 (USD Million)
  175.   6.23 BENCHMARKING OF MAJOR COMPETITORS
  176. 7 LIST OF TABLES
  177.   7.1 LIST OF ASSUMPTIONS
  178.     7.1.1
  179.   7.2 US MARKET SIZE ESTIMATES; FORECAST
  180.     7.2.1 BY FUNCTIONALITY, 2025-2035 (USD Million)
  181.     7.2.2 BY TYPE, 2025-2035 (USD Million)
  182.     7.2.3 BY FLAVOUR, 2025-2035 (USD Million)
  183.     7.2.4 BY RAW MATERIAL, 2025-2035 (USD Million)
  184.     7.2.5 BY FORM, 2025-2035 (USD Million)
  185.   7.3 PRODUCT LAUNCH/PRODUCT DEVELOPMENT/APPROVAL
  186.     7.3.1
  187.   7.4 ACQUISITION/PARTNERSHIP
  188.     7.4.1

US Construction Market Segmentation

Construction By Functionality (USD Million, 2025-2035)

  • Glazing
  • Stabilizing
  • Viscosity
  • Flavour Enhancing
  • Texturizing

Construction By Type (USD Million, 2025-2035)

  • Syrups
  • Pastes and Variegates
  • Creams
  • Fruit and Nuts
  • Sprinkles

Construction By Flavour (USD Million, 2025-2035)

  • Fruit
  • Chocolate
  • Vanilla
  • Nut
  • Caramel
  • Other Flavours

Construction By Raw Material (USD Million, 2025-2035)

  • Sweetener
  • Fruit
  • Cocoa
  • Dairy Ingredients
  • Texturizers
  • Others

Construction By Form (USD Million, 2025-2035)

  • Solid
  • Liquid
  • Gel
  • Foam

Compare Licence

×
Features License Type
Single User Multiuser License Enterprise User
Price $4,950 $5,950 $7,250
Maximum User Access Limit 1 User Upto 10 Users Unrestricted Access Throughout the Organization
Free Customization
Direct Access to Analyst
Deliverable Format
Platform Access
Discount on Next Purchase 10% 15% 15%
Printable Versions