Request Free Sample ×

Kindly complete the form below to receive a free sample of this Report

* Please use a valid business email

Leading companies partner with us for data-driven Insights

clients tt-cursor
Hero Background

US Automotive supercharger Market

ID: MRFR/AT/13500-HCR
100 Pages
Triveni Bhoyar
Last Updated: May 05, 2026

US Automotive Supercharger Market Research Report By Technology (Twin Screw, Centrifugal, Roots), By Source Of Power (IC Engine, Electric Motor), By Fuel Type (Petrol, Diesel) and By Vehicle Type (Passenger, Commercial, Motorcycle) - Forecast to 2035

Share:
Download PDF ×

We do not share your information with anyone. However, we may send you emails based on your report interest from time to time. You may contact us at any time to opt-out.

US Automotive supercharger Market Infographic
Purchase Options
  1. SECTION I: EXECUTIVE SUMMARY AND KEY HIGHLIGHTS |
    1. 1.1 EXECUTIVE SUMMARY | |
      1. 1.1.1 Market Overview | |
      2. 1.1.2 Key Findings | |
      3. 1.1.3 Market Segmentation | |
      4. 1.1.4 Competitive Landscape | |
      5. 1.1.5 Challenges and Opportunities | |
      6. 1.1.6 Future Outlook 2
  2. SECTION II: SCOPING, METHODOLOGY AND MARKET STRUCTURE |
    1. 2.1 MARKET INTRODUCTION | |
      1. 2.1.1 Definition | |
      2. 2.1.2 Scope of the study | | |
        1. 2.1.2.1 Research Objective | | |
        2. 2.1.2.2 Assumption | | |
        3. 2.1.2.3 Limitations |
    2. 2.2 RESEARCH METHODOLOGY | |
      1. 2.2.1 Overview | |
      2. 2.2.2 Data Mining | |
      3. 2.2.3 Secondary Research | |
      4. 2.2.4 Primary Research | | |
        1. 2.2.4.1 Primary Interviews and Information Gathering Process | | |
        2. 2.2.4.2 Breakdown of Primary Respondents | |
      5. 2.2.5 Forecasting Model | |
      6. 2.2.6 Market Size Estimation | | |
        1. 2.2.6.1 Bottom-Up Approach | | |
        2. 2.2.6.2 Top-Down Approach | |
      7. 2.2.7 Data Triangulation | |
      8. 2.2.8 Validation 3
  3. SECTION III: QUALITATIVE ANALYSIS |
    1. 3.1 MARKET DYNAMICS | |
      1. 3.1.1 Overview | |
      2. 3.1.2 Drivers | |
      3. 3.1.3 Restraints | |
      4. 3.1.4 Opportunities |
    2. 3.2 MARKET FACTOR ANALYSIS | |
      1. 3.2.1 Value chain Analysis | |
      2. 3.2.2 Porter's Five Forces Analysis | | |
        1. 3.2.2.1 Bargaining Power of Suppliers | | |
        2. 3.2.2.2 Bargaining Power of Buyers | | |
        3. 3.2.2.3 Threat of New Entrants | | |
        4. 3.2.2.4 Threat of Substitutes | | |
        5. 3.2.2.5 Intensity of Rivalry | |
      3. 3.2.3 COVID-19 Impact Analysis | | |
        1. 3.2.3.1 Market Impact Analysis | | |
        2. 3.2.3.2 Regional Impact | | |
        3. 3.2.3.3 Opportunity and Threat Analysis 4
  4. SECTION IV: QUANTITATIVE ANALYSIS |
    1. 4.1 Automobile, BY Technology (USD Million) | |
      1. 4.1.1 Twin-Screw | |
      2. 4.1.2 Centrifugal | |
      3. 4.1.3 Roots |
    2. 4.2 Automobile, BY Source of Power (USD Million) | |
      1. 4.2.1 IC Engine | |
      2. 4.2.2 Electric Motor |
    3. 4.3 Automobile, BY Fuel Type (USD Million) | |
      1. 4.3.1 Petrol | |
      2. 4.3.2 Diesel |
    4. 4.4 Automobile, BY Vehicle Type (USD Million) | |
      1. 4.4.1 Passenger | |
      2. 4.4.2 Commercial | |
      3. 4.4.3 Motorcycle 5
  5. SECTION V: COMPETITIVE ANALYSIS |
    1. 5.1 Competitive Landscape | |
      1. 5.1.1 Overview | |
      2. 5.1.2 Competitive Analysis | |
      3. 5.1.3 Market share Analysis | |
      4. 5.1.4 Major Growth Strategy in the Automobile | |
      5. 5.1.5 Competitive Benchmarking | |
      6. 5.1.6 Leading Players in Terms of Number of Developments in the Automobile | |
      7. 5.1.7 Key developments and growth strategies | | |
        1. 5.1.7.1 New Product Launch/Service Deployment | | |
        2. 5.1.7.2 Merger & Acquisitions | | |
        3. 5.1.7.3 Joint Ventures | |
      8. 5.1.8 Major Players Financial Matrix | | |
        1. 5.1.8.1 Sales and Operating Income | | |
        2. 5.1.8.2 Major Players R&D Expenditure. 2023 |
    2. 5.2 Company Profiles | |
      1. 5.2.1 Eaton (GB) | | |
        1. 5.2.1.1 Financial Overview | | |
        2. 5.2.1.2 Products Offered | | |
        3. 5.2.1.3 Key Developments | | |
        4. 5.2.1.4 SWOT Analysis | | |
        5. 5.2.1.5 Key Strategies | |
      2. 5.2.2 Magnuson Superchargers (US) | | |
        1. 5.2.2.1 Financial Overview | | |
        2. 5.2.2.2 Products Offered | | |
        3. 5.2.2.3 Key Developments | | |
        4. 5.2.2.4 SWOT Analysis | | |
        5. 5.2.2.5 Key Strategies | |
      3. 5.2.3 Whipple Superchargers (US) | | |
        1. 5.2.3.1 Financial Overview | | |
        2. 5.2.3.2 Products Offered | | |
        3. 5.2.3.3 Key Developments | | |
        4. 5.2.3.4 SWOT Analysis | | |
        5. 5.2.3.5 Key Strategies | |
      4. 5.2.4 Roush Performance (US) | | |
        1. 5.2.4.1 Financial Overview | | |
        2. 5.2.4.2 Products Offered | | |
        3. 5.2.4.3 Key Developments | | |
        4. 5.2.4.4 SWOT Analysis | | |
        5. 5.2.4.5 Key Strategies | |
      5. 5.2.5 Kenne Bell (US) | | |
        1. 5.2.5.1 Financial Overview | | |
        2. 5.2.5.2 Products Offered | | |
        3. 5.2.5.3 Key Developments | | |
        4. 5.2.5.4 SWOT Analysis | | |
        5. 5.2.5.5 Key Strategies | |
      6. 5.2.6 ProCharger (US) | | |
        1. 5.2.6.1 Financial Overview | | |
        2. 5.2.6.2 Products Offered | | |
        3. 5.2.6.3 Key Developments | | |
        4. 5.2.6.4 SWOT Analysis | | |
        5. 5.2.6.5 Key Strategies | |
      7. 5.2.7 A&A Corvette (US) | | |
        1. 5.2.7.1 Financial Overview | | |
        2. 5.2.7.2 Products Offered | | |
        3. 5.2.7.3 Key Developments | | |
        4. 5.2.7.4 SWOT Analysis | | |
        5. 5.2.7.5 Key Strategies | |
      8. 5.2.8 Vortech Superchargers (US) | | |
        1. 5.2.8.1 Financial Overview | | |
        2. 5.2.8.2 Products Offered | | |
        3. 5.2.8.3 Key Developments | | |
        4. 5.2.8.4 SWOT Analysis | | |
        5. 5.2.8.5 Key Strategies |
    3. 5.3 Appendix | |
      1. 5.3.1 References | |
      2. 5.3.2 Related Reports 6 LIST OF FIGURES |
    4. 6.1 MARKET SYNOPSIS |
    5. 6.2 US MARKET ANALYSIS BY TECHNOLOGY |
    6. 6.3 US MARKET ANALYSIS BY SOURCE OF POWER |
    7. 6.4 US MARKET ANALYSIS BY FUEL TYPE |
    8. 6.5 US MARKET ANALYSIS BY VEHICLE TYPE |
    9. 6.6 KEY BUYING CRITERIA OF AUTOMOBILE |
    10. 6.7 RESEARCH PROCESS OF MRFR |
    11. 6.8 DRO ANALYSIS OF AUTOMOBILE |
    12. 6.9 DRIVERS IMPACT ANALYSIS: AUTOMOBILE |
    13. 6.10 RESTRAINTS IMPACT ANALYSIS: AUTOMOBILE |
    14. 6.11 SUPPLY / VALUE CHAIN: AUTOMOBILE |
    15. 6.12 AUTOMOBILE, BY TECHNOLOGY, 2024 (% SHARE) |
    16. 6.13 AUTOMOBILE, BY TECHNOLOGY, 2024 TO 2035 (USD Million) |
    17. 6.14 AUTOMOBILE, BY SOURCE OF POWER, 2024 (% SHARE) |
    18. 6.15 AUTOMOBILE, BY SOURCE OF POWER, 2024 TO 2035 (USD Million) |
    19. 6.16 AUTOMOBILE, BY FUEL TYPE, 2024 (% SHARE) |
    20. 6.17 AUTOMOBILE, BY FUEL TYPE, 2024 TO 2035 (USD Million) |
    21. 6.18 AUTOMOBILE, BY VEHICLE TYPE, 2024 (% SHARE) |
    22. 6.19 AUTOMOBILE, BY VEHICLE TYPE, 2024 TO 2035 (USD Million) |
    23. 6.20 BENCHMARKING OF MAJOR COMPETITORS 7 LIST OF TABLES |
    24. 7.1 LIST OF ASSUMPTIONS | |
      1. 7.1.1 |
    25. 7.2 US MARKET SIZE ESTIMATES; FORECAST | |
      1. 7.2.1 BY TECHNOLOGY, 2025-2035 (USD Million) | |
      2. 7.2.2 BY SOURCE OF POWER, 2025-2035 (USD Million) | |
      3. 7.2.3 BY FUEL TYPE, 2025-2035 (USD Million) | |
      4. 7.2.4 BY VEHICLE TYPE, 2025-2035 (USD Million) |
    26. 7.3 PRODUCT LAUNCH/PRODUCT DEVELOPMENT/APPROVAL | |
      1. 7.3.1 |
    27. 7.4 ACQUISITION/PARTNERSHIP | |

US Automobile Market Segmentation

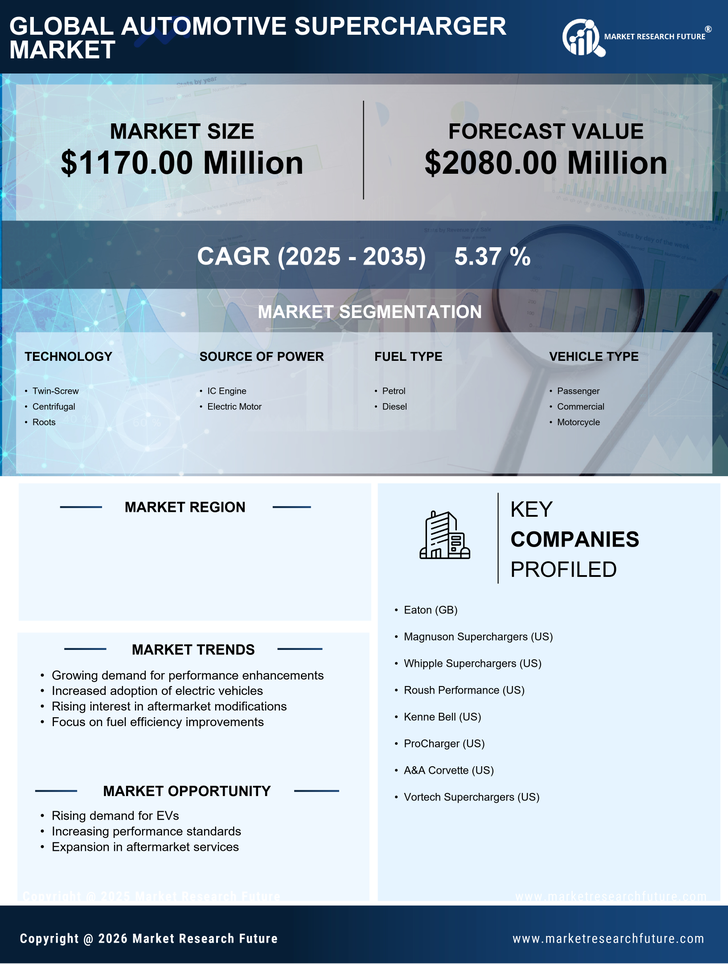
Automobile By Technology (USD Million, 2025-2035)

  • Twin-Screw
  • Centrifugal
  • Roots

Automobile By Source of Power (USD Million, 2025-2035)

  • IC Engine
  • Electric Motor

Automobile By Fuel Type (USD Million, 2025-2035)

  • Petrol
  • Diesel

Automobile By Vehicle Type (USD Million, 2025-2035)

  • Passenger
  • Commercial
  • Motorcycle

Compare Licence

×
Features License Type
Single User Multiuser License Enterprise User
Price $4,950 $5,950 $7,250
Maximum User Access Limit 1 User Upto 10 Users Unrestricted Access Throughout the Organization
Free Customization
Direct Access to Analyst
Deliverable Format
Platform Access
Discount on Next Purchase 10% 15% 15%
Printable Versions