

US Information and Communications Technology Market Segmentation
Information and Communications Technology By Application (USD Million, 2025-2035)
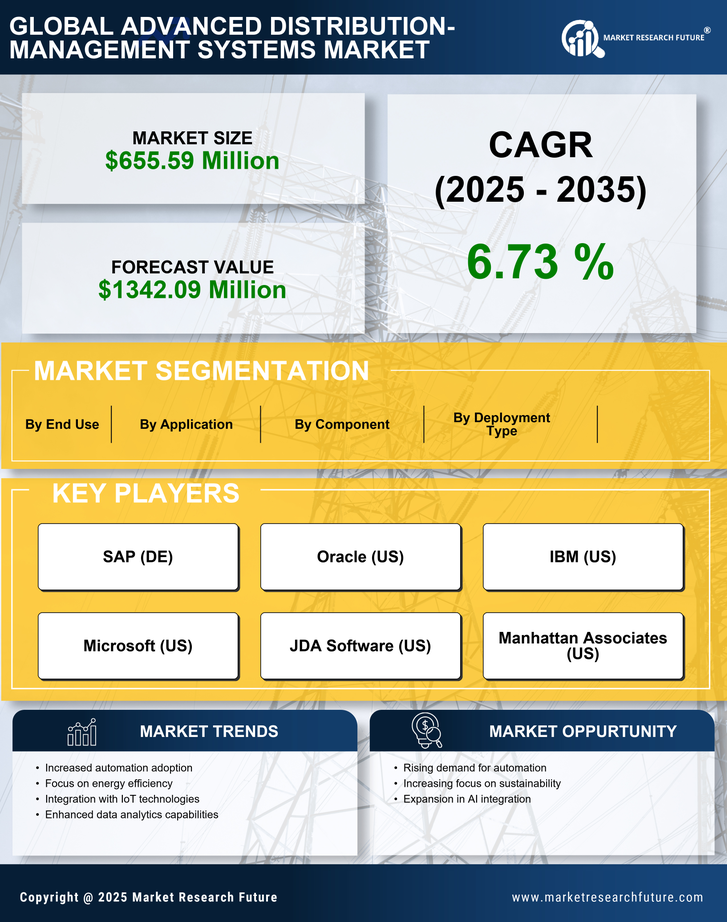
- Distribution Network Management
- Load Management
- Power Quality Management
- Grid Automation
Information and Communications Technology By Deployment Type (USD Million, 2025-2035)
- On-Premise
- Cloud-Based
- Hybrid
Information and Communications Technology By Component (USD Million, 2025-2035)
- Software
- Services
- Support and Maintenance
Information and Communications Technology By End Use (USD Million, 2025-2035)
- Utilities
- Renewable Energy Providers
- Industrial


