UK United Kingdom E Bike Market Segmentation
United Kingdom E Bike Market By Type (USD Million, 2025-2035)
- Pedelec
- Speed Pedelec
- Throttle E-Bikes
- Folding E-Bikes
United Kingdom E Bike Market By Application (USD Million, 2025-2035)
- Commuting
- Leisure
- Fitness
- Delivery Services
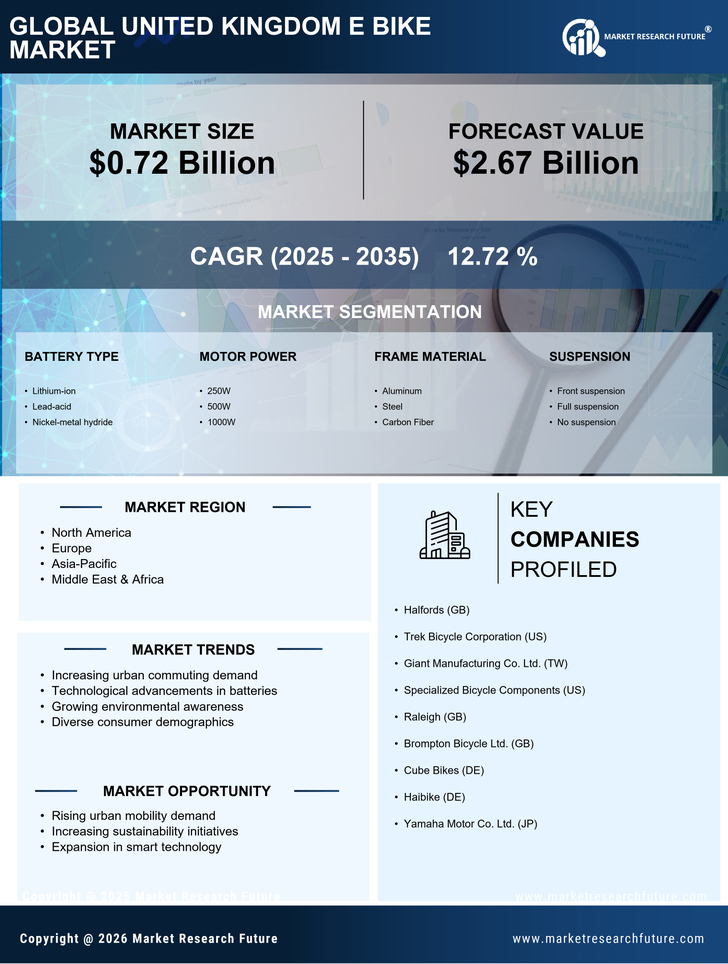
United Kingdom E Bike Market By Battery Type (USD Million, 2025-2035)
- Lithium-Ion
- Lead Acid
- Nickel-Metal Hydride
United Kingdom E Bike Market By Motor Placement (USD Million, 2025-2035)
- Hub Motor
- Mid-Drive Motor
- Dual Motor
United Kingdom E Bike Market By Price Range (USD Million, 2025-2035)
- Economy
- Mid-Range
- Premium