Ultra-Thin Glass Market Segmentation
Ultra-Thin Glass Market By Manufacturing Process (USD Billion, 2025-2035)
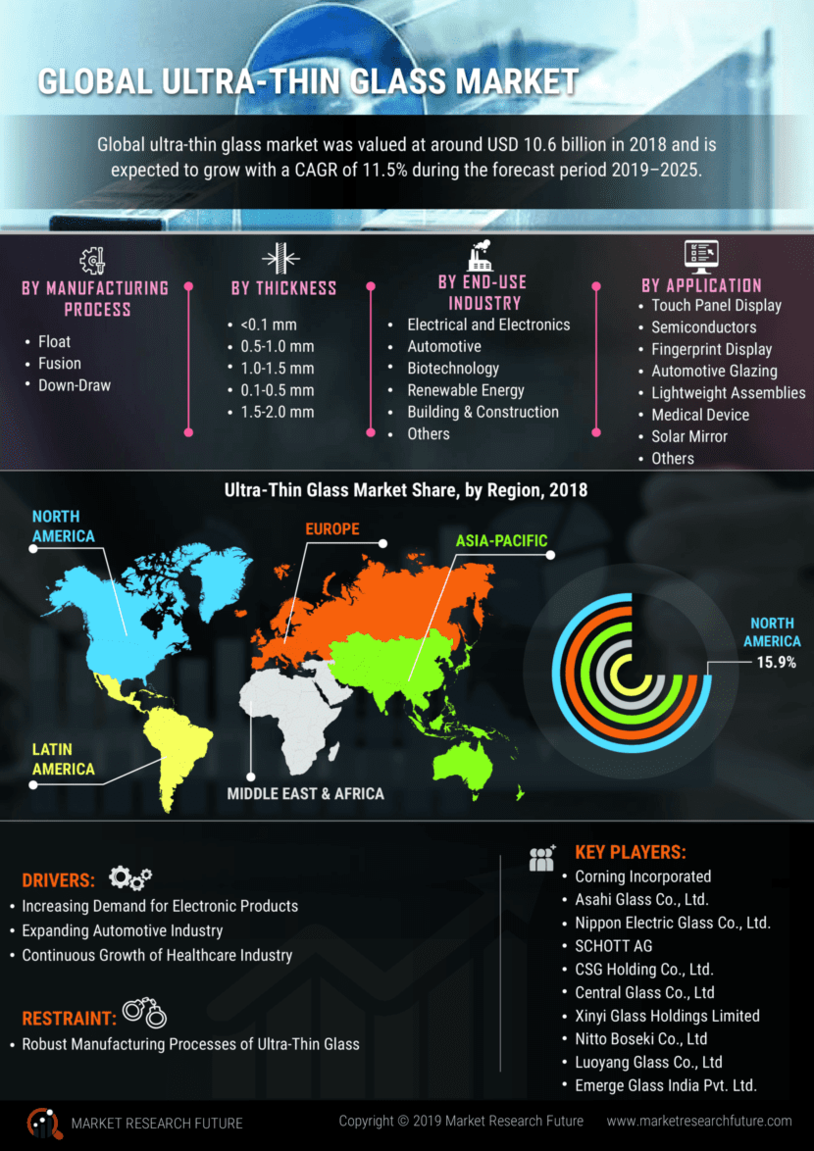
- Float
- Fusion
Ultra-Thin Glass Market By Application (USD Billion, 2025-2035)
- Touch Panel Displays
- Semiconductors
Ultra-Thin Glass Market By End-Use (USD Billion, 2025-2035)
- Electrical & Electronics
- Automotive