UK Smart TV Market

ID: MRFR/SEM/55908-HCR
200 Pages
Ankit Gupta
Last Updated: April 24, 2026
UK Smart TV Market Size, Share and Research Report By Resolution (4K UHD TV, HDTV, Full HD TV, 8K TV), By Operating System (Android TV, Tizen, WebOS, Roku, Other), By Screen Size (Light, Below 32 inches, 32 to 45 inches, 46 to 55 inches, 56 to 65 inches, Above 65 inches) and By Screen Shape (Flat, Curved)- Industry Forecast Till 2035
Download PDF ×

We do not share your information with anyone. However, we may send you emails based on your report interest from time to time. You may contact us at any time to opt-out.

UK Smart TV Market

Market Size

Forecast Period2025 - 2035
CAGR (2025 - 2035)14.21%
2024 Market Size$ 10,900 Million
2025 Market Size$ 12,448.89 Million
2035 Market Size$ 47,000 Million

Key Players

Samsung Electronics
LG Electronics
Sony Corporation
TCL Technology
Hisense Group
Panasonic Corporation
Opportunities
  • Growing Popularity of Interactive Content
  • Rising Awareness of Smart Home Integration
  • Technological Advancements in Display Quality
  1. 1 SECTION I: EXECUTIVE SUMMARY AND KEY HIGHLIGHTS
    1. 1.1 EXECUTIVE SUMMARY
      1. 1.1.1 Market Overview
      2. 1.1.2 Key Findings
      3. 1.1.3 Market Segmentation
      4. 1.1.4 Competitive Landscape
      5. 1.1.5 Challenges and Opportunities
      6. 1.1.6 Future Outlook
  2. 2 SECTION II: SCOPING, METHODOLOGY AND MARKET STRUCTURE
    1. 2.1 MARKET INTRODUCTION
      1. 2.1.1 Definition
      2. 2.1.2 Scope of the study
        1. 2.1.2.1 Research Objective
        2. 2.1.2.2 Assumption
        3. 2.1.2.3 Limitations
    2. 2.2 RESEARCH METHODOLOGY
      1. 2.2.1 Overview
      2. 2.2.2 Data Mining
      3. 2.2.3 Secondary Research
      4. 2.2.4 Primary Research
        1. 2.2.4.1 Primary Interviews and Information Gathering Process
        2. 2.2.4.2 Breakdown of Primary Respondents
      5. 2.2.5 Forecasting Model
      6. 2.2.6 Market Size Estimation
        1. 2.2.6.1 Bottom-Up Approach
        2. 2.2.6.2 Top-Down Approach
      7. 2.2.7 Data Triangulation
      8. 2.2.8 Validation
  3. 3 SECTION III: QUALITATIVE ANALYSIS
    1. 3.1 MARKET DYNAMICS
      1. 3.1.1 Overview
      2. 3.1.2 Drivers
      3. 3.1.3 Restraints
      4. 3.1.4 Opportunities
    2. 3.2 MARKET FACTOR ANALYSIS
      1. 3.2.1 Value chain Analysis
      2. 3.2.2 Porter's Five Forces Analysis
        1. 3.2.2.1 Bargaining Power of Suppliers
        2. 3.2.2.2 Bargaining Power of Buyers
        3. 3.2.2.3 Threat of New Entrants
        4. 3.2.2.4 Threat of Substitutes
        5. 3.2.2.5 Intensity of Rivalry
      3. 3.2.3 COVID-19 Impact Analysis
        1. 3.2.3.1 Market Impact Analysis
        2. 3.2.3.2 Regional Impact
        3. 3.2.3.3 Opportunity and Threat Analysis
  4. 4 SECTION IV: QUANTITATIVE ANALYSIS
    1. 4.1 Semiconductor & Electronics, BY Resolution (USD Million)
      1. 4.1.1 4K UHD TV
      2. 4.1.2 HDTV
      3. 4.1.3 Full HD TV
      4. 4.1.4 8K TV
    2. 4.2 Semiconductor & Electronics, BY Operating System (USD Million)
      1. 4.2.1 Android TV
      2. 4.2.2 Tizen
      3. 4.2.3 WebOS
      4. 4.2.4 Roku
      5. 4.2.5 Other
    3. 4.3 Semiconductor & Electronics, BY Screen Size (USD Million)
      1. 4.3.1 Light
      2. 4.3.2 Below 32 inches
      3. 4.3.3 32 to 45 inches
      4. 4.3.4 46 to 55 inches
      5. 4.3.5 56 to 65 inches
      6. 4.3.6 Above 65 inches
    4. 4.4 Semiconductor & Electronics, BY Screen Shape (USD Million)
      1. 4.4.1 Flat
      2. 4.4.2 Curved
  5. 5 SECTION V: COMPETITIVE ANALYSIS
    1. 5.1 Competitive Landscape
      1. 5.1.1 Overview
      2. 5.1.2 Competitive Analysis
      3. 5.1.3 Market share Analysis
      4. 5.1.4 Major Growth Strategy in the Semiconductor & Electronics
      5. 5.1.5 Competitive Benchmarking
      6. 5.1.6 Leading Players in Terms of Number of Developments in the Semiconductor & Electronics
      7. 5.1.7 Key developments and growth strategies
        1. 5.1.7.1 New Product Launch/Service Deployment
        2. 5.1.7.2 Merger & Acquisitions
        3. 5.1.7.3 Joint Ventures
      8. 5.1.8 Major Players Financial Matrix
        1. 5.1.8.1 Sales and Operating Income
        2. 5.1.8.2 Major Players R&D Expenditure. 2023
    2. 5.2 Company Profiles
      1. 5.2.1 Samsung Electronics (KR)
        1. 5.2.1.1 Financial Overview
        2. 5.2.1.2 Products Offered
        3. 5.2.1.3 Key Developments
        4. 5.2.1.4 SWOT Analysis
        5. 5.2.1.5 Key Strategies
      2. 5.2.2 LG Electronics (KR)
        1. 5.2.2.1 Financial Overview
        2. 5.2.2.2 Products Offered
        3. 5.2.2.3 Key Developments
        4. 5.2.2.4 SWOT Analysis
        5. 5.2.2.5 Key Strategies
      3. 5.2.3 Sony Corporation (JP)
        1. 5.2.3.1 Financial Overview
        2. 5.2.3.2 Products Offered
        3. 5.2.3.3 Key Developments
        4. 5.2.3.4 SWOT Analysis
        5. 5.2.3.5 Key Strategies
      4. 5.2.4 TCL Technology (CN)
        1. 5.2.4.1 Financial Overview
        2. 5.2.4.2 Products Offered
        3. 5.2.4.3 Key Developments
        4. 5.2.4.4 SWOT Analysis
        5. 5.2.4.5 Key Strategies
      5. 5.2.5 Hisense Group (CN)
        1. 5.2.5.1 Financial Overview
        2. 5.2.5.2 Products Offered
        3. 5.2.5.3 Key Developments
        4. 5.2.5.4 SWOT Analysis
        5. 5.2.5.5 Key Strategies
      6. 5.2.6 Panasonic Corporation (JP)
        1. 5.2.6.1 Financial Overview
        2. 5.2.6.2 Products Offered
        3. 5.2.6.3 Key Developments
        4. 5.2.6.4 SWOT Analysis
        5. 5.2.6.5 Key Strategies
      7. 5.2.7 Philips (NL)
        1. 5.2.7.1 Financial Overview
        2. 5.2.7.2 Products Offered
        3. 5.2.7.3 Key Developments
        4. 5.2.7.4 SWOT Analysis
        5. 5.2.7.5 Key Strategies
      8. 5.2.8 Sharp Corporation (JP)
        1. 5.2.8.1 Financial Overview
        2. 5.2.8.2 Products Offered
        3. 5.2.8.3 Key Developments
        4. 5.2.8.4 SWOT Analysis
        5. 5.2.8.5 Key Strategies
      9. 5.2.9 Vizio (US)
        1. 5.2.9.1 Financial Overview
        2. 5.2.9.2 Products Offered
        3. 5.2.9.3 Key Developments
        4. 5.2.9.4 SWOT Analysis
        5. 5.2.9.5 Key Strategies
    3. 5.3 Appendix
      1. 5.3.1 References
      2. 5.3.2 Related Reports
  6. 6 LIST OF FIGURES
    1. 6.1 MARKET SYNOPSIS
    2. 6.2 UK MARKET ANALYSIS BY RESOLUTION
    3. 6.3 UK MARKET ANALYSIS BY OPERATING SYSTEM
    4. 6.4 UK MARKET ANALYSIS BY SCREEN SIZE
    5. 6.5 UK MARKET ANALYSIS BY SCREEN SHAPE
    6. 6.6 KEY BUYING CRITERIA OF SEMICONDUCTOR & ELECTRONICS
    7. 6.7 RESEARCH PROCESS OF MRFR
    8. 6.8 DRO ANALYSIS OF SEMICONDUCTOR & ELECTRONICS
    9. 6.9 DRIVERS IMPACT ANALYSIS: SEMICONDUCTOR & ELECTRONICS
    10. 6.10 RESTRAINTS IMPACT ANALYSIS: SEMICONDUCTOR & ELECTRONICS
    11. 6.11 SUPPLY / VALUE CHAIN: SEMICONDUCTOR & ELECTRONICS
    12. 6.12 SEMICONDUCTOR & ELECTRONICS, BY RESOLUTION, 2024 (% SHARE)
    13. 6.13 SEMICONDUCTOR & ELECTRONICS, BY RESOLUTION, 2024 TO 2035 (USD Million)
    14. 6.14 SEMICONDUCTOR & ELECTRONICS, BY OPERATING SYSTEM, 2024 (% SHARE)
    15. 6.15 SEMICONDUCTOR & ELECTRONICS, BY OPERATING SYSTEM, 2024 TO 2035 (USD Million)
    16. 6.16 SEMICONDUCTOR & ELECTRONICS, BY SCREEN SIZE, 2024 (% SHARE)
    17. 6.17 SEMICONDUCTOR & ELECTRONICS, BY SCREEN SIZE, 2024 TO 2035 (USD Million)
    18. 6.18 SEMICONDUCTOR & ELECTRONICS, BY SCREEN SHAPE, 2024 (% SHARE)
    19. 6.19 SEMICONDUCTOR & ELECTRONICS, BY SCREEN SHAPE, 2024 TO 2035 (USD Million)
    20. 6.20 BENCHMARKING OF MAJOR COMPETITORS
  7. 7 LIST OF TABLES
    1. 7.1 LIST OF ASSUMPTIONS
  8. 7.1.1
    1. 7.2 UK MARKET SIZE ESTIMATES; FORECAST
      1. 7.2.1 BY RESOLUTION, 2025-2035 (USD Million)
      2. 7.2.2 BY OPERATING SYSTEM, 2025-2035 (USD Million)
      3. 7.2.3 BY SCREEN SIZE, 2025-2035 (USD Million)
      4. 7.2.4 BY SCREEN SHAPE, 2025-2035 (USD Million)
    2. 7.3 PRODUCT LAUNCH/PRODUCT DEVELOPMENT/APPROVAL
  9. 7.3.1
    1. 7.4 ACQUISITION/PARTNERSHIP
  10. 7.4.1

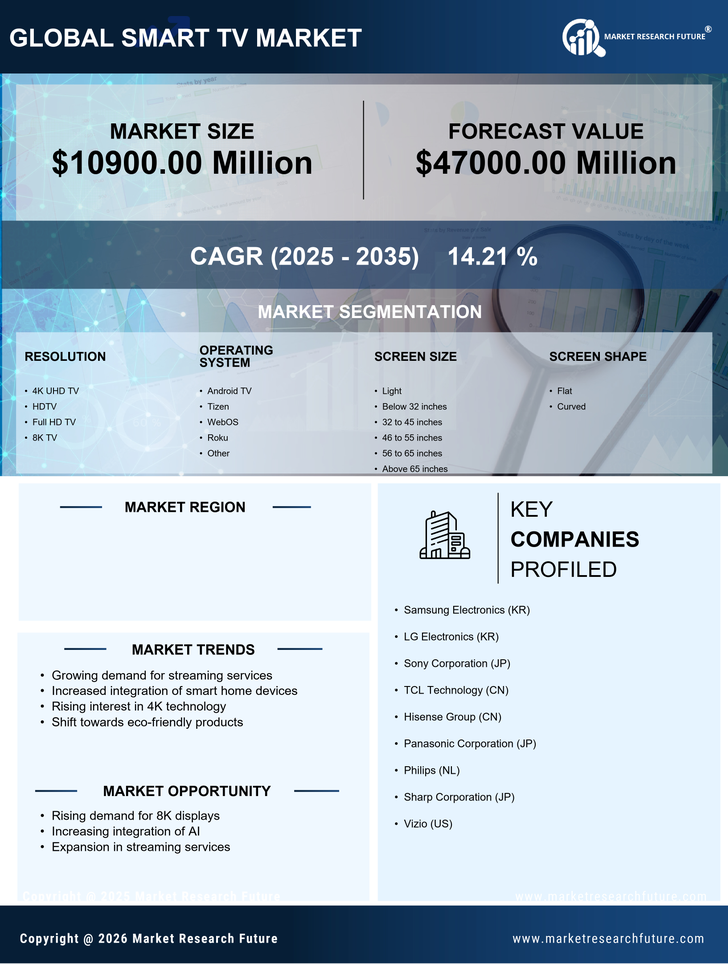
UK UK Smart TV Market Segmentation

UK Smart TV Market By Resolution (USD Million, 2025-2035)

  • 4K UHD TV
  • HDTV
  • Full HD TV
  • 8K TV

UK Smart TV Market By Operating System (USD Million, 2025-2035)

  • Android TV
  • Tizen
  • WebOS
  • Roku
  • Other

UK Smart TV Market By Screen Size (USD Million, 2025-2035)

  • Light
  • Below 32 inches
  • 32 to 45 inches
  • 46 to 55 inches
  • 56 to 65 inches
  • Above 65 inches

UK Smart TV Market By Screen Shape (USD Million, 2025-2035)

  • Flat
  • Curved