Request Free Sample ×

Kindly complete the form below to receive a free sample of this Report

* Please use a valid business email

Leading companies partner with us for data-driven Insights

clients tt-cursor
Hero Background

UK Singleplex Immunoassay Market

ID: MRFR/HC/54373-HCR
200 Pages
Nidhi Mandole
Last Updated: February 06, 2026

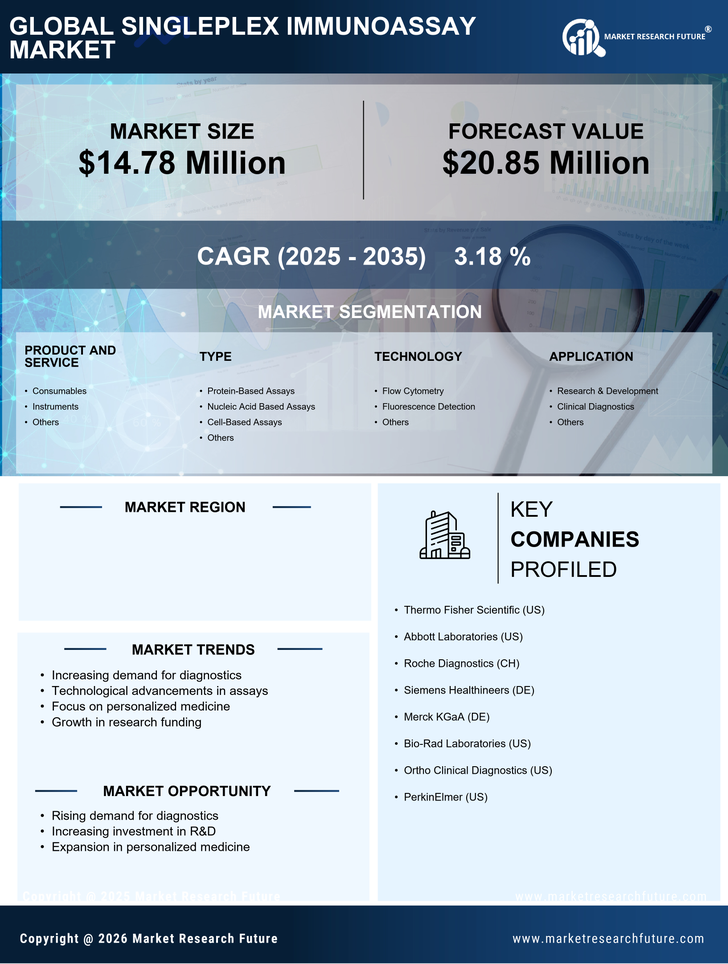
UK Singleplex Immunoassay Market Research Report By Product and Service (Consumables, Instruments, Others), By Type (Protein-Based Assays, Nucleic Acid Based Assays, Cell-Based Assays, Others), By Technology (Flow Cytometry, Fluorescence Detection), By Application (Research & Development, Drug Discovery & Development, Biomarker Discovery & Validation, Clinical Diagnostics, Infectious Diseases, Cancer, Cardiovascular Diseases, Autoimmune Diseases, Nervous System Disorders, Metabolism & Endocrinology Disorders, Others) and By End-user (Pharmaceutical and amp; Biotechnology Companies, Hospitals and amp; Research Institutes, Reference Laboratories, Others) Forecast to 2035

Share:
Download PDF ×

We do not share your information with anyone. However, we may send you emails based on your report interest from time to time. You may contact us at any time to opt-out.

UK Singleplex Immunoassay Market Infographic
Purchase Options
  1. 1 SECTION I: EXECUTIVE SUMMARY AND KEY HIGHLIGHTS
  2.   1.1 EXECUTIVE SUMMARY
  3.     1.1.1 Market Overview
  4.     1.1.2 Key Findings
  5.     1.1.3 Market Segmentation
  6.     1.1.4 Competitive Landscape
  7.     1.1.5 Challenges and Opportunities
  8.     1.1.6 Future Outlook
  9. 2 SECTION II: SCOPING, METHODOLOGY AND MARKET STRUCTURE
  10.   2.1 MARKET INTRODUCTION
  11.     2.1.1 Definition
  12.     2.1.2 Scope of the study
  13.       2.1.2.1 Research Objective
  14.       2.1.2.2 Assumption
  15.       2.1.2.3 Limitations
  16.   2.2 RESEARCH METHODOLOGY
  17.     2.2.1 Overview
  18.     2.2.2 Data Mining
  19.     2.2.3 Secondary Research
  20.     2.2.4 Primary Research
  21.       2.2.4.1 Primary Interviews and Information Gathering Process
  22.       2.2.4.2 Breakdown of Primary Respondents
  23.     2.2.5 Forecasting Model
  24.     2.2.6 Market Size Estimation
  25.       2.2.6.1 Bottom-Up Approach
  26.       2.2.6.2 Top-Down Approach
  27.     2.2.7 Data Triangulation
  28.     2.2.8 Validation
  29. 3 SECTION III: QUALITATIVE ANALYSIS
  30.   3.1 MARKET DYNAMICS
  31.     3.1.1 Overview
  32.     3.1.2 Drivers
  33.     3.1.3 Restraints
  34.     3.1.4 Opportunities
  35.   3.2 MARKET FACTOR ANALYSIS
  36.     3.2.1 Value chain Analysis
  37.     3.2.2 Porter's Five Forces Analysis
  38.       3.2.2.1 Bargaining Power of Suppliers
  39.       3.2.2.2 Bargaining Power of Buyers
  40.       3.2.2.3 Threat of New Entrants
  41.       3.2.2.4 Threat of Substitutes
  42.       3.2.2.5 Intensity of Rivalry
  43.     3.2.3 COVID-19 Impact Analysis
  44.       3.2.3.1 Market Impact Analysis
  45.       3.2.3.2 Regional Impact
  46.       3.2.3.3 Opportunity and Threat Analysis
  47. 4 SECTION IV: QUANTITATIVE ANALYSIS
  48.   4.1 Life Sciences, BY Product and Service (USD Million)
  49.     4.1.1 Consumables
  50.     4.1.2 Instruments
  51.     4.1.3 Others
  52.   4.2 Life Sciences, BY Type (USD Million)
  53.     4.2.1 Protein-Based Assays
  54.     4.2.2 Nucleic Acid Based Assays
  55.     4.2.3 Cell-Based Assays
  56.     4.2.4 Others
  57.   4.3 Life Sciences, BY Technology (USD Million)
  58.     4.3.1 Flow Cytometry
  59.     4.3.2 Fluorescence Detection
  60.     4.3.3 Others
  61.   4.4 Life Sciences, BY Application (USD Million)
  62.     4.4.1 Research & Development
  63.     4.4.2 Clinical Diagnostics
  64.     4.4.3 Others
  65.   4.5 Life Sciences, BY End-user (USD Million)
  66.     4.5.1 Pharmaceutical & Biotechnology Companies
  67.     4.5.2 Hospitals & Research Institutes
  68.     4.5.3 Reference Laboratories
  69.     4.5.4 Others
  70. 5 SECTION V: COMPETITIVE ANALYSIS
  71.   5.1 Competitive Landscape
  72.     5.1.1 Overview
  73.     5.1.2 Competitive Analysis
  74.     5.1.3 Market share Analysis
  75.     5.1.4 Major Growth Strategy in the Life Sciences
  76.     5.1.5 Competitive Benchmarking
  77.     5.1.6 Leading Players in Terms of Number of Developments in the Life Sciences
  78.     5.1.7 Key developments and growth strategies
  79.       5.1.7.1 New Product Launch/Service Deployment
  80.       5.1.7.2 Merger & Acquisitions
  81.       5.1.7.3 Joint Ventures
  82.     5.1.8 Major Players Financial Matrix
  83.       5.1.8.1 Sales and Operating Income
  84.       5.1.8.2 Major Players R&D Expenditure. 2023
  85.   5.2 Company Profiles
  86.     5.2.1 Thermo Fisher Scientific (US)
  87.       5.2.1.1 Financial Overview
  88.       5.2.1.2 Products Offered
  89.       5.2.1.3 Key Developments
  90.       5.2.1.4 SWOT Analysis
  91.       5.2.1.5 Key Strategies
  92.     5.2.2 Abbott Laboratories (US)
  93.       5.2.2.1 Financial Overview
  94.       5.2.2.2 Products Offered
  95.       5.2.2.3 Key Developments
  96.       5.2.2.4 SWOT Analysis
  97.       5.2.2.5 Key Strategies
  98.     5.2.3 Roche Diagnostics (CH)
  99.       5.2.3.1 Financial Overview
  100.       5.2.3.2 Products Offered
  101.       5.2.3.3 Key Developments
  102.       5.2.3.4 SWOT Analysis
  103.       5.2.3.5 Key Strategies
  104.     5.2.4 Siemens Healthineers (DE)
  105.       5.2.4.1 Financial Overview
  106.       5.2.4.2 Products Offered
  107.       5.2.4.3 Key Developments
  108.       5.2.4.4 SWOT Analysis
  109.       5.2.4.5 Key Strategies
  110.     5.2.5 Merck KGaA (DE)
  111.       5.2.5.1 Financial Overview
  112.       5.2.5.2 Products Offered
  113.       5.2.5.3 Key Developments
  114.       5.2.5.4 SWOT Analysis
  115.       5.2.5.5 Key Strategies
  116.     5.2.6 Bio-Rad Laboratories (US)
  117.       5.2.6.1 Financial Overview
  118.       5.2.6.2 Products Offered
  119.       5.2.6.3 Key Developments
  120.       5.2.6.4 SWOT Analysis
  121.       5.2.6.5 Key Strategies
  122.     5.2.7 Ortho Clinical Diagnostics (US)
  123.       5.2.7.1 Financial Overview
  124.       5.2.7.2 Products Offered
  125.       5.2.7.3 Key Developments
  126.       5.2.7.4 SWOT Analysis
  127.       5.2.7.5 Key Strategies
  128.     5.2.8 PerkinElmer (US)
  129.       5.2.8.1 Financial Overview
  130.       5.2.8.2 Products Offered
  131.       5.2.8.3 Key Developments
  132.       5.2.8.4 SWOT Analysis
  133.       5.2.8.5 Key Strategies
  134.   5.3 Appendix
  135.     5.3.1 References
  136.     5.3.2 Related Reports
  137. 6 LIST OF FIGURES
  138.   6.1 MARKET SYNOPSIS
  139.   6.2 UK MARKET ANALYSIS BY PRODUCT AND SERVICE
  140.   6.3 UK MARKET ANALYSIS BY TYPE
  141.   6.4 UK MARKET ANALYSIS BY TECHNOLOGY
  142.   6.5 UK MARKET ANALYSIS BY APPLICATION
  143.   6.6 UK MARKET ANALYSIS BY END-USER
  144.   6.7 KEY BUYING CRITERIA OF LIFE SCIENCES
  145.   6.8 RESEARCH PROCESS OF MRFR
  146.   6.9 DRO ANALYSIS OF LIFE SCIENCES
  147.   6.10 DRIVERS IMPACT ANALYSIS: LIFE SCIENCES
  148.   6.11 RESTRAINTS IMPACT ANALYSIS: LIFE SCIENCES
  149.   6.12 SUPPLY / VALUE CHAIN: LIFE SCIENCES
  150.   6.13 LIFE SCIENCES, BY PRODUCT AND SERVICE, 2024 (% SHARE)
  151.   6.14 LIFE SCIENCES, BY PRODUCT AND SERVICE, 2024 TO 2035 (USD Million)
  152.   6.15 LIFE SCIENCES, BY TYPE, 2024 (% SHARE)
  153.   6.16 LIFE SCIENCES, BY TYPE, 2024 TO 2035 (USD Million)
  154.   6.17 LIFE SCIENCES, BY TECHNOLOGY, 2024 (% SHARE)
  155.   6.18 LIFE SCIENCES, BY TECHNOLOGY, 2024 TO 2035 (USD Million)
  156.   6.19 LIFE SCIENCES, BY APPLICATION, 2024 (% SHARE)
  157.   6.20 LIFE SCIENCES, BY APPLICATION, 2024 TO 2035 (USD Million)
  158.   6.21 LIFE SCIENCES, BY END-USER, 2024 (% SHARE)
  159.   6.22 LIFE SCIENCES, BY END-USER, 2024 TO 2035 (USD Million)
  160.   6.23 BENCHMARKING OF MAJOR COMPETITORS
  161. 7 LIST OF TABLES
  162.   7.1 LIST OF ASSUMPTIONS
  163.     7.1.1
  164.   7.2 UK MARKET SIZE ESTIMATES; FORECAST
  165.     7.2.1 BY PRODUCT AND SERVICE, 2025-2035 (USD Million)
  166.     7.2.2 BY TYPE, 2025-2035 (USD Million)
  167.     7.2.3 BY TECHNOLOGY, 2025-2035 (USD Million)
  168.     7.2.4 BY APPLICATION, 2025-2035 (USD Million)
  169.     7.2.5 BY END-USER, 2025-2035 (USD Million)
  170.   7.3 PRODUCT LAUNCH/PRODUCT DEVELOPMENT/APPROVAL
  171.     7.3.1
  172.   7.4 ACQUISITION/PARTNERSHIP
  173.     7.4.1

UK Life Sciences Market Segmentation

Life Sciences By Product and Service (USD Million, 2025-2035)

  • Consumables
  • Instruments
  • Others

Life Sciences By Type (USD Million, 2025-2035)

  • Protein-Based Assays
  • Nucleic Acid Based Assays
  • Cell-Based Assays
  • Others

Life Sciences By Technology (USD Million, 2025-2035)

  • Flow Cytometry
  • Fluorescence Detection
  • Others

Life Sciences By Application (USD Million, 2025-2035)

  • Research & Development
  • Clinical Diagnostics
  • Others

Life Sciences By End-user (USD Million, 2025-2035)

  • Pharmaceutical & Biotechnology Companies
  • Hospitals & Research Institutes
  • Reference Laboratories
  • Others

Compare Licence

×
Features License Type
Single User Multiuser License Enterprise User
Price $4,950 $5,950 $7,250
Maximum User Access Limit 1 User Upto 10 Users Unrestricted Access Throughout the Organization
Free Customization
Direct Access to Analyst
Deliverable Format
Platform Access
Discount on Next Purchase 10% 15% 15%
Printable Versions