

UK Food, Beverages & Nutrition Market Segmentation
Food, Beverages & Nutrition By Technology (USD Million, 2025-2035)
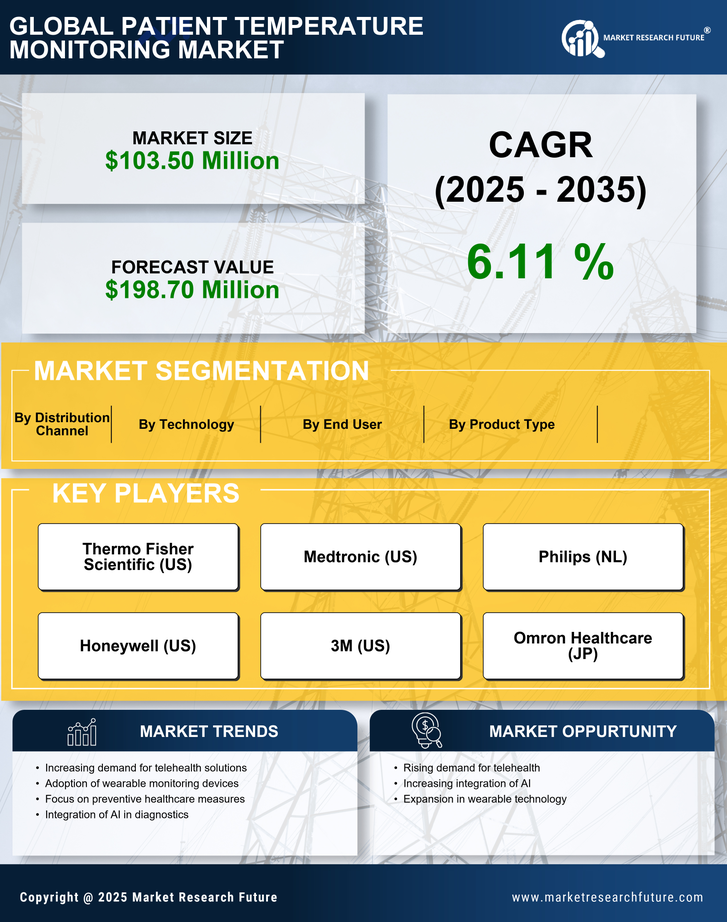
- Digital Thermometers
- Infrared Thermometers
- Disposable Thermometers
- Electronic Thermometers
Food, Beverages & Nutrition By Product Type (USD Million, 2025-2035)
- Forehead Thermometers
- In-ear Thermometers
- Oral Thermometers
- Rectal Thermometers
Food, Beverages & Nutrition By End User (USD Million, 2025-2035)
- Hospitals
- Home Care Settings
- Ambulatory Surgical Centers
- Diagnostic Centers
Food, Beverages & Nutrition By Distribution Channel (USD Million, 2025-2035)
- Online Pharmacies
- Retail Pharmacies
- Direct Sales


