

UK Industrial Automation & Equipment Market Segmentation
Industrial Automation & Equipment By Type (USD Million, 2025-2035)
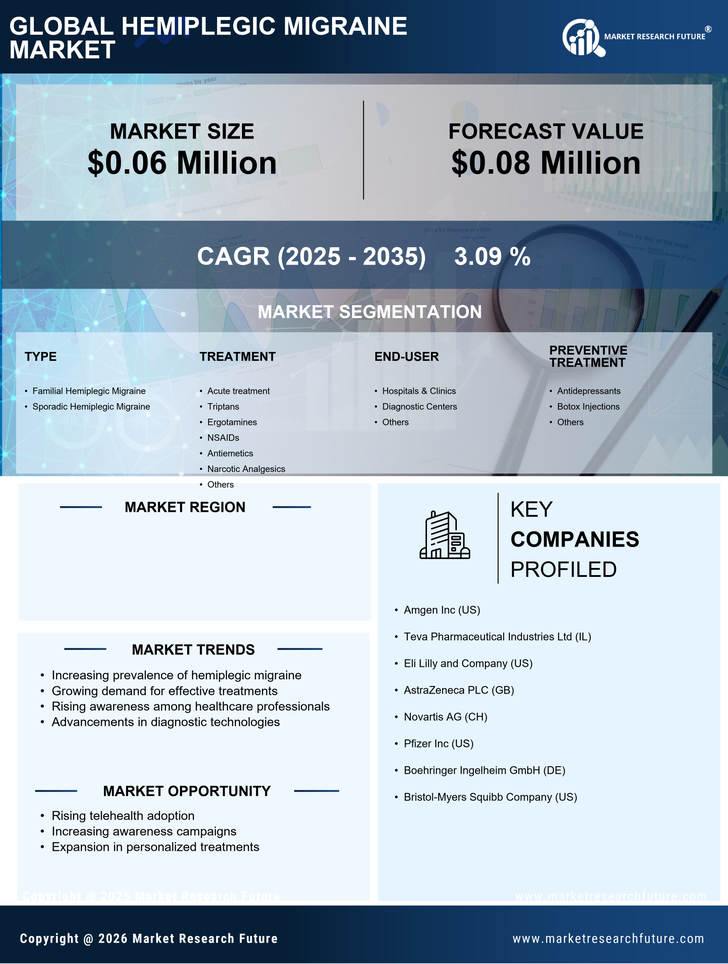
- Familial Hemiplegic Migraine
- Sporadic Hemiplegic Migraine
Industrial Automation & Equipment By Treatment (USD Million, 2025-2035)
- Acute treatment
- Triptans
- Ergotamines
- NSAIDs
- Antiemetics
- Narcotic Analgesics
- Others
Industrial Automation & Equipment By End-user (USD Million, 2025-2035)
- Hospitals & Clinics
- Diagnostic Centers
- Others
Industrial Automation & Equipment By Preventive Treatment (USD Million, 2025-2035)
- Antidepressants
- Botox Injections
- Others
Industrial Automation & Equipment By Distribution Channel (USD Million, 2025-2035)
- Retail Pharmacies
- Hospital Pharmacies
- Online Pharmacies
- Others


