UK Construction Market Segmentation
Construction By Treatment Type (USD Million, 2025-2035)
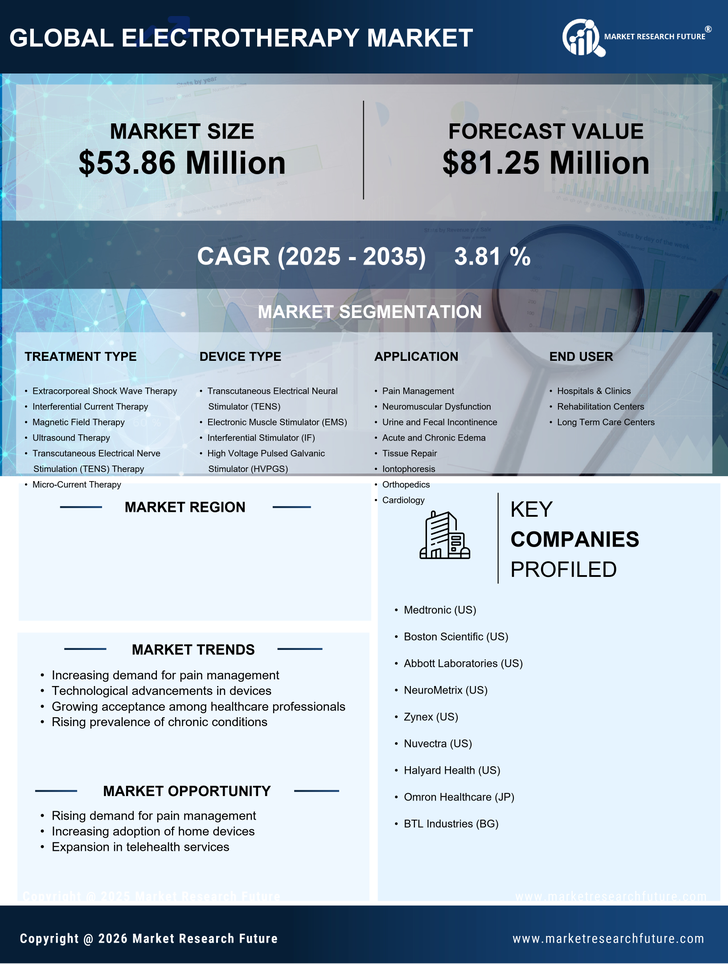
- Extracorporeal Shock Wave Therapy
- Interferential Current Therapy
- Magnetic Field Therapy
- Ultrasound Therapy
- Transcutaneous Electrical Nerve Stimulation (TENS) Therapy
- Micro-Current Therapy
Construction By Device Type (USD Million, 2025-2035)
- Transcutaneous Electrical Neural Stimulator (TENS)
- Electronic Muscle Stimulator (EMS)
- Interferential Stimulator (IF)
- High Voltage Pulsed Galvanic Stimulator (HVPGS)
Construction By Application (USD Million, 2025-2035)
- Pain Management
- Neuromuscular Dysfunction
- Urine and Fecal Incontinence
- Acute and Chronic Edema
- Tissue Repair
- Iontophoresis
- Orthopedics
- Cardiology
Construction By End User (USD Million, 2025-2035)
- Hospitals & Clinics
- Rehabilitation Centers
- Long Term Care Centers