

UK Construction Market Segmentation
Construction By Type (USD Billion, 2025-2035)
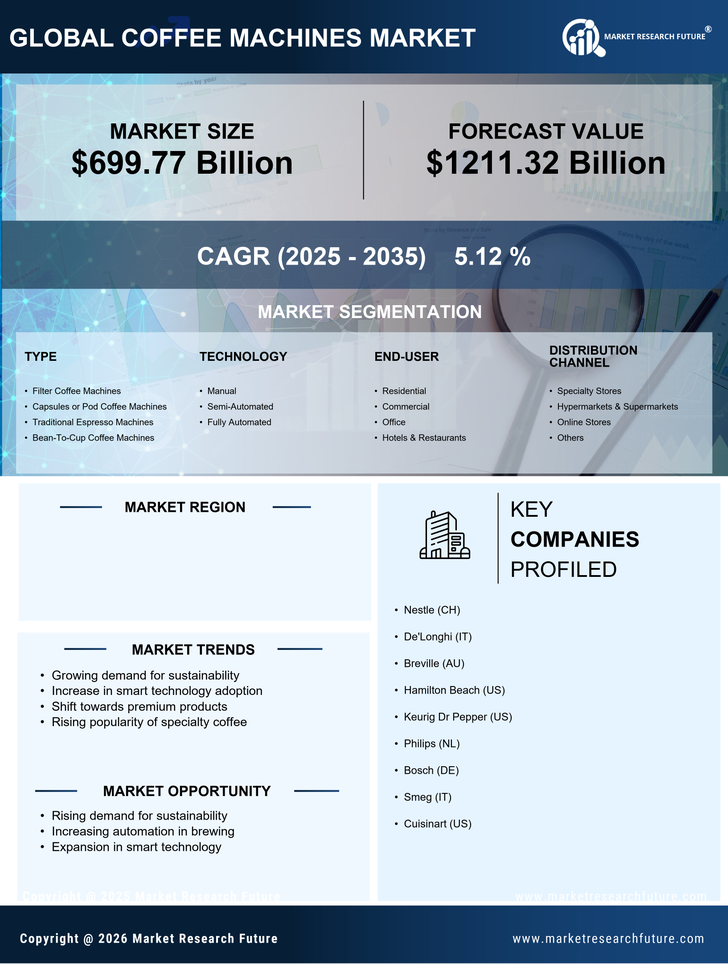
- Filter Coffee Machines
- Capsules or Pod Coffee Machines
- Traditional Espresso Machines
- Bean-To-Cup Coffee Machines
Construction By Technology (USD Billion, 2025-2035)
- Manual
- Semi-Automated
- Fully Automated
Construction By End-User (USD Billion, 2025-2035)
- Residential
- Commercial
- Office
- Hotels & Restaurants
Construction By Distribution Channel (USD Billion, 2025-2035)
- Specialty Stores
- Hypermarkets & Supermarkets
- Online Stores
- Others


