×
  • Cat-intel
  • MedIntelliX
  • Resources
  • About Us
  • Hero Background
    English
    Chinese
    French
    Japanese
    Korean
    German
    Spanish

    Type 2 Diabetes Mellitus Treatment Market Analysis

    ID: MRFR/Pharma/4214-HCR
    85 Pages
    Rahul Gotadki
    October 2025

    Type 2 Diabetes Mellitus Treatment Market Research Report Information By Treatment (Drug (Insulin, Sensitizers, Sglt-2, Alpha-Glucosidase Inhibitors, Others), Devices (Blood Glucose Monitoring, Insulin Delivery Devices)), By The End User – Forecast Till 2035

    Share:
    Download PDF ×

    We do not share your information with anyone. However, we may send you emails based on your report interest from time to time. You may contact us at any time to opt-out.

    Type 2 Diabetes Mellitus Treatment Market Infographic
    Purchase Options

    Market Analysis

    Type 2 Diabetes Mellitus Treatment Market (Global, 2024)

    Introduction

    Type 2 diabetes treatment market is set to witness a number of transformations as the global health care system prepares to cope with the rising prevalence of this chronic condition. The burgeoning focus on precision medicine and innovation is leading to a proliferation of new treatment options, including new pharmacological agents, digital health solutions, and lifestyle intervention programs. Awareness of the importance of early diagnosis and treatment is generating demand for effective treatment options. Moreover, the increasing use of technology, such as continuous glucose monitoring and telehealth, is transforming patient engagement and adherence to treatment. As pharmaceutical companies, physicians, and policymakers attempt to cope with the evolving landscape, an understanding of the dynamics of the type 2 diabetes treatment market will be critical to improving patient outcomes and addressing the global diabetes epidemic.

    PESTLE Analysis

    Political
    In 2024, the government's policy against diabetes led to the increase of research and treatment. The United States government gave $ 1.5 billion to the National Institutes of Health for diabetes research. This showed a strong commitment to the increasing occurrence of Type 2 diabetes. Various countries also tightened up regulations on sugar in food. The British government introduced a sugar tax that has raised more than £400 million since it came into effect. The money has been reinvested in public health.
    Economic
    In the U.S., the total spending on health care is expected to reach $ 4 Trillion by 2024. This increase is partly due to the rising costs of diabetes care, which includes medications, hospitalization and outpatient care. The average annual cost of diabetes per patient is $16,750, with about $ 9,600 going toward direct medical costs. This imposes a heavy burden on both the individual and the health care system.
    Social
    Type II diabetes has been a major concern of the public for some time. As of 2024, 342 million adults in the United States were diabetic. The government has focused on a public health campaign, stressing the importance of a healthy lifestyle. There has been a significant increase in participation in diabetes prevention programs. The increase in enrollment was about 25 percent. Also, the stigma of diabetes is gradually being reduced as more people speak out about their experiences and advocate for better management and treatment.
    Technological
    In the field of diabetes, technological progress is rapidly developing, and the world market for diabetes devices is expected to reach $26 billion by 2024. Glucose monitors and devices for injecting insulin are becoming more and more accessible. There are already more than three million users of continuous monitors in the United States. And telehealth services have increased in diabetes care, with a reported increase of 60 percent in the number of virtual consultations for patients with diabetes.
    Legal
    The legal framework regulating the treatment of diabetes is becoming stricter. In 2024 the Food and Drug Administration (FDA) approved twelve new diabetes drugs, thereby showing a premeditated concern for the safety and effectiveness of these drugs. The Affordable Care Act, which requires that diabetes screening and preventive services be covered by health insurance plans without co-payments, has benefited millions of people. It is important for pharmaceutical companies and health care institutions to abide by these regulations to avoid fines.
    Environmental
    Environmental factors are becoming increasingly important in the treatment of type 2 diabetes mellitus, particularly in relation to the sustainable management of medical waste. In 2024, it is estimated that the health care sector will generate about 5.9 million tons of medical waste, of which a significant proportion will consist of diabetes-related items such as syringes and test strips. Efforts are being made to reduce this waste, and initiatives are being launched to encourage the reuse and proper disposal of medical waste and the development of biodegradable medical products.

    Porter's Five Forces

    Threat of New Entrants
    The barriers to entry in the treatment of type 2 diabetes are moderate, as the market requires significant investment in research and development, regulatory approvals, and the establishment of distribution channels. However, the growing demand for innovation and the high potential returns may attract new players to the market, resulting in a moderate threat level.
    Bargaining Power of Suppliers
    The power of suppliers on the market is relatively weak, as there are many suppliers of raw materials and pharmaceuticals. There are many suppliers, and the companies can easily change the supplier, which reduces the power of the supplier.
    Bargaining Power of Buyers
    The buyers in the Type 2 diabetes treatment market, that is, the hospitals and the patients, have high bargaining power. The treatment options are many and the demand for cost-effectiveness is high. The increasing availability of generics and the increasing demand for individualized treatment make the buyers’ power even greater.
    Threat of Substitutes
    The threat of substitutes is moderate. Several treatment options are available, such as lifestyle changes, dietary changes and non-pharmaceutical treatments. However, the effectiveness and acceptance of these alternatives may vary, which may limit their impact on the market.
    Competitive Rivalry
    Competition is High - The competition in the Type 2 diabetes mellitus treatment market is high because of the presence of a large number of established pharmaceutical companies and the constant introduction of new therapies. The companies compete with each other through aggressive marketing, product differentiation, and innovation in order to gain market share.

    SWOT Analysis

    Strengths

    • Increasing prevalence of Type 2 diabetes driving demand for treatment options.
    • Advancements in technology leading to innovative treatment solutions.
    • Strong pipeline of new drugs and therapies under development.

    Weaknesses

    • High cost of new treatments may limit accessibility for some patients.
    • Complexity of treatment regimens can lead to poor patient adherence.
    • Limited awareness and education about Type 2 diabetes management.

    Opportunities

    • Growing focus on preventive healthcare and lifestyle management.
    • Expansion of telemedicine and digital health solutions for diabetes care.
    • Potential for partnerships with tech companies to enhance treatment delivery.

    Threats

    • Regulatory challenges and lengthy approval processes for new therapies.
    • Intense competition among pharmaceutical companies in the diabetes market.
    • Economic downturns affecting healthcare budgets and patient spending.

    Summary

    The type-2 diabetes treatment market in 2024 is characterized by a strong demand, owing to the rising prevalence of the disease and the technological advancements in the treatment. Nevertheless, there are still some obstacles to overcome, such as high costs and the lack of patient compliance. Opportunities exist in the field of preventive care and digital solutions, while regulatory barriers and competition may impact the market dynamics. Strategically, education and partnership building may strengthen market positions.

    Author
    Rahul Gotadki
    Assistant Manager

    He holds an experience of about 7+ years in Market Research and Business Consulting, working under the spectrum of Life Sciences and Healthcare domains. Rahul conceptualizes and implements a scalable business strategy and provides strategic leadership to the clients. His expertise lies in market estimation, competitive intelligence, pipeline analysis, customer assessment, etc. In addition to the above, his other responsibility includes strategic tracking of high growth markets & advising clients on the potential areas of focus they could direct their business initiatives

    Leave a Comment

    Market Summary

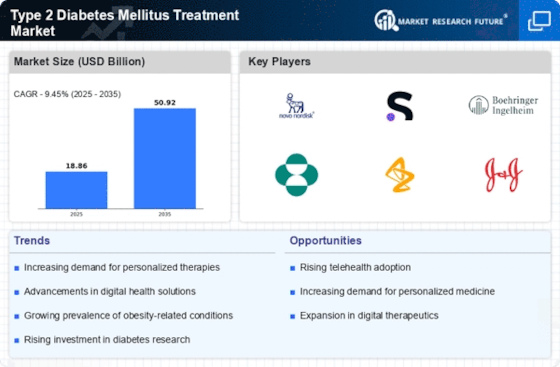
    As per MRFR analysis, the Type 2 Diabetes Mellitus Treatment Market was estimated at 18.86 USD Billion in 2024. The Type 2 Diabetes Mellitus Treatment industry is projected to grow from 20.64 USD Billion in 2025 to 50.92 USD Billion by 2035, exhibiting a compound annual growth rate (CAGR) of 9.45 during the forecast period 2025 - 2035.

    Key Market Trends & Highlights

    The Type 2 Diabetes Mellitus Treatment Market is experiencing a transformative shift towards innovative solutions and preventive care strategies.

    • The rise of digital health solutions is reshaping patient engagement and management in Type 2 diabetes treatment.
    • North America remains the largest market, driven by advancements in pharmacotherapy and increasing healthcare expenditure.
    • The Asia-Pacific region is emerging as the fastest-growing market, fueled by a rising prevalence of Type 2 diabetes and growing awareness initiatives.
    • The insulin segment continues to dominate, while SGLT-2 inhibitors are gaining traction, supported by regulatory backing for innovative therapies.

    Market Size & Forecast

    2024 Market Size 18.86 (USD Billion)
    2035 Market Size 50.92 (USD Billion)
    CAGR (2025 - 2035) 9.45%
    Largest Regional Market Share in 2024 Americas

    Major Players

    <p>Novo Nordisk (DK), Sanofi (FR), Boehringer Ingelheim (DE), Merck & Co. (US), AstraZeneca (GB), Johnson & Johnson (US), Eli Lilly and Company (US), Pfizer (US), AbbVie (US)</p>

    Market Trends

    The Type 2 Diabetes Mellitus Treatment Market is currently experiencing a notable evolution, driven by a combination of innovative therapies and a growing awareness of diabetes management. As healthcare systems worldwide increasingly prioritize chronic disease management, the demand for effective treatment options appears to be on the rise. This market encompasses a diverse range of products, including oral medications, insulin therapies, and lifestyle management solutions. The integration of technology, such as telemedicine and mobile health applications, seems to enhance patient engagement and adherence to treatment regimens, potentially leading to improved health outcomes. Moreover, the increasing prevalence of obesity and sedentary lifestyles contributes to the rising incidence of Type 2 diabetes, thereby expanding the market's scope. Pharmaceutical companies are likely to invest in research and development to create novel therapies that address the underlying causes of the disease. Additionally, the emphasis on personalized medicine suggests a shift towards tailored treatment approaches, which may further transform the landscape of the Type 2 Diabetes Mellitus Treatment Market. As stakeholders navigate this dynamic environment, collaboration among healthcare providers, patients, and technology developers appears essential for optimizing treatment strategies and enhancing patient quality of life.

    Rise of Digital Health Solutions

    The integration of digital health technologies is reshaping the Type 2 Diabetes Mellitus Treatment Market. Mobile applications and telehealth platforms are becoming increasingly popular, enabling patients to monitor their health and communicate with healthcare providers more effectively. This trend suggests a shift towards more personalized and accessible care, potentially improving patient adherence to treatment plans.

    Focus on Preventive Care

    There is a growing emphasis on preventive care within the Type 2 Diabetes Mellitus Treatment Market. Healthcare providers are increasingly advocating for lifestyle modifications, such as diet and exercise, to prevent the onset of diabetes. This proactive approach may lead to a reduction in the overall burden of the disease and a shift in treatment paradigms.

    Advancements in Pharmacotherapy

    Recent advancements in pharmacotherapy are significantly influencing the Type 2 Diabetes Mellitus Treatment Market. New classes of medications, including GLP-1 receptor agonists and SGLT2 inhibitors, are emerging, offering improved efficacy and safety profiles. These innovations indicate a potential for better management of the disease and enhanced patient outcomes.

    Type 2 Diabetes Mellitus Treatment Market Market Drivers

    Rising Healthcare Expenditure

    The increase in healthcare spending is a significant factor influencing the Type 2 Diabetes Mellitus Treatment Market. As countries allocate more resources to healthcare, there is a corresponding rise in investments in diabetes care and management. This trend is evident in both developed and developing regions, where governments and private sectors are prioritizing diabetes treatment as a critical public health issue. Enhanced funding allows for the development of new therapies, improved healthcare infrastructure, and better access to treatment for patients. Consequently, the growing healthcare expenditure is likely to facilitate advancements in diabetes management, thereby driving the demand for Type 2 Diabetes treatments.

    Increasing Prevalence of Type 2 Diabetes

    The rising incidence of Type 2 Diabetes Mellitus is a primary driver for the Type 2 Diabetes Mellitus Treatment Market. According to recent statistics, the number of individuals diagnosed with this condition continues to escalate, with estimates suggesting that over 400 million people are affected worldwide. This alarming trend is attributed to factors such as sedentary lifestyles, unhealthy dietary habits, and increasing obesity rates. As the prevalence of Type 2 Diabetes rises, the demand for effective treatment options, including medications and lifestyle interventions, is likely to grow. Consequently, pharmaceutical companies and healthcare providers are focusing on developing innovative therapies and comprehensive management programs to address this urgent public health challenge.

    Growing Awareness and Education Initiatives

    Increasing awareness about Type 2 Diabetes and its management is a crucial driver for the Type 2 Diabetes Mellitus Treatment Market. Public health campaigns and educational programs aimed at promoting healthy lifestyles and early detection of diabetes are gaining traction. These initiatives are instrumental in informing individuals about the risks associated with Type 2 Diabetes and the importance of timely intervention. As awareness grows, more individuals are likely to seek medical advice and treatment, thereby expanding the market for diabetes therapies. Additionally, healthcare providers are increasingly emphasizing the need for patient education, which is expected to enhance treatment adherence and improve overall health outcomes.

    Regulatory Support for Innovative Therapies

    Regulatory bodies are increasingly supporting the development of innovative therapies for Type 2 Diabetes, which serves as a key driver for the Type 2 Diabetes Mellitus Treatment Market. Initiatives aimed at expediting the approval process for new medications and treatment modalities are becoming more common. This regulatory support encourages pharmaceutical companies to invest in research and development, leading to the introduction of novel therapies that can improve patient outcomes. As these innovative treatments enter the market, they are expected to enhance the overall treatment landscape for Type 2 Diabetes, providing patients with more effective options and potentially increasing market growth.

    Technological Advancements in Treatment Options

    Technological innovations are significantly shaping the Type 2 Diabetes Mellitus Treatment Market. The emergence of advanced treatment modalities, such as continuous glucose monitoring systems and insulin delivery devices, has transformed diabetes management. These technologies not only enhance patient adherence but also improve glycemic control, thereby reducing the risk of complications associated with Type 2 Diabetes. Furthermore, the integration of artificial intelligence and machine learning in treatment protocols appears to optimize personalized care, tailoring interventions to individual patient needs. As these technologies become more accessible and affordable, they are expected to drive market growth by providing patients with more effective and convenient treatment options.

    Market Segment Insights

    By Treatment: Drug Class (Largest) vs. Devices (Fastest-Growing)

    <p>The treatment segment for Type 2 Diabetes Mellitus primarily divides into two key categories: drug classes and devices. Drug classes have historically held the largest market share due to their established effectiveness in glucose control and their extensive availability. These medications, such as GLP-1 receptor agonists and SGLT2 inhibitors, are widely prescribed and dominate the therapeutic landscape. In comparison, diabetes management devices, particularly insulin pumps and continuous glucose monitors, while currently representing a smaller segment, are rapidly growing in popularity as technology advances and consumer awareness increases.</p>

    <p>Drug Class (Dominant) vs. Devices (Emerging)</p>

    <p>Within the Type 2 Diabetes Mellitus Treatment Market, drug classes serve as the dominant force, being integral to standard treatment protocols. These medications are characterized by their ability to enhance glycemic control and reduce complications associated with diabetes. They are often preferred by healthcare providers due to their clinical efficacy and established safety profiles. On the other hand, devices, categorized as emerging, are witnessing transformative growth driven by innovation and patient-centric solutions. As technology plays a critical role in diabetes self-management, devices like continuous glucose monitors and smart insulin pens are becoming increasingly popular due to their ability to provide real-time data and facilitate proactive healthcare decisions.</p>

    By Drug Class: Insulin (Largest) vs. SGLT-2 Inhibitors (Fastest-Growing)

    <p>The Type 2 Diabetes Mellitus Treatment Market is diverse, with several drug classes competing for market share. Insulin remains the largest segment, providing critical glucose regulation for patients, followed by SGLT-2 inhibitors, which have been gaining traction due to their dual benefits of glucose control and weight loss. Other notable classes include sensitizers and secretagogues, which focus on improving insulin sensitivity and stimulating insulin secretion, respectively, but they have yet to capture the same level of attention as insulin and SGLT-2 inhibitors.</p>

    <p>Insulin (Dominant) vs. SGLT-2 Inhibitors (Emerging)</p>

    <p>Insulin therapy continues to dominate the Type 2 Diabetes Mellitus treatment landscape due to its established efficacy and wide use in clinical practice. It is particularly essential for patients with significant beta-cell dysfunction. In contrast, SGLT-2 inhibitors are emerging as a pivotal treatment option, especially for patients concerned about cardiovascular health and weight management. These medications not only lower glucose levels but also provide nephroprotective effects, making them an attractive choice for many healthcare providers. Both segments serve distinct patient needs, with insulin representing traditional therapy and SGLT-2 inhibitors reflecting a progressive shift towards comprehensive diabetes management.</p>

    By Devices: Blood Glucose Monitoring Devices (Largest) vs. Insulin Delivery Devices (Fastest-Growing)

    <p>In the Type 2 Diabetes Mellitus Treatment Market, Blood Glucose Monitoring Devices hold the largest market share, dominating the segment due to their crucial role in patient self-management. These devices are essential for providing real-time blood glucose level readings, enabling users to make informed decisions about their health. In contrast, Insulin Delivery Devices, while having a smaller market share, are rapidly gaining traction and are recognized as the fastest-growing segment. This growth is driven by an increasing prevalence of Type 2 diabetes and the ongoing innovations in insulin delivery technology.</p>

    <p>Blood Glucose Monitoring Devices (Dominant) vs. Insulin Delivery Devices (Emerging)</p>

    <p>Blood Glucose Monitoring Devices are pivotal in managing Type 2 diabetes, allowing patients to track their glucose levels, thus aiding in better treatment decisions. These devices come in various forms, including traditional fingerstick meters and continuous glucose monitors, and their adoption is largely driven by the need for accurate and timely data in diabetes management. On the other hand, Insulin Delivery Devices, characterized by advancements such as insulin pens and pumps, represent an emerging technology with significant potential. They are designed to improve patient adherence by simplifying insulin administration, which is crucial for effective diabetes management. The convergence of convenience and reliability in insulin delivery is propelling this segment forward.</p>

    By End User: Hospitals (Largest) vs. Clinics (Fastest-Growing)

    <p>In the Type 2 Diabetes Mellitus Treatment Market, hospitals represent the largest segment in terms of market share, attributed to their comprehensive treatment facilities and access to advanced technologies. They cater to a diverse patient population, providing a range of services that includes diagnostics, treatment, and ongoing management of diabetes. Following closely, clinics are rapidly increasing their market presence as a preferred option for outpatient care, reflecting a shift towards more accessible and personalized treatment options for patients.</p>

    <p>End Users: Hospitals (Dominant) vs. Clinics (Emerging)</p>

    <p>Hospitals are the dominant players in the Type 2 Diabetes Mellitus Treatment Market due to their extensive resources and treatment capabilities, offering everything from emergency care to specialized diabetes management programs. They often have well-established relationships with pharmaceutical companies and medical suppliers, ensuring a steady supply of the latest treatments. Conversely, clinics are emerging as significant competitors, focusing on individualized care and diabetes education. Their growing popularity stems from their convenience and the ability to provide tailored treatment plans that meet patients' specific needs, which are becoming increasingly important in managing chronic conditions like diabetes.</p>

    Get more detailed insights about Type 2 Diabetes Mellitus Treatment Market Research Report - Forecast to 2035

    Regional Insights

    Key Companies in the Type 2 Diabetes Mellitus Treatment Market market include

    Industry Developments

    • Q2 2025: ADA 2025: Advances in Type 2 Diabetes Management With Tirzepatide At the 85th Scientific Sessions of the American Diabetes Association in June 2025, Eli Lilly's tirzepatide (Mounjaro, Zepbound) was highlighted for its unique mechanism and clinical data supporting its use in type 2 diabetes management. The session provided updated insights into tirzepatide’s FDA-approved indications and its role in personalized treatment plans.

    Type 2 Diabetes Mellitus Treatment Market Regional Analysis

    The Americas dominate the type 2 diabetes mellitus treatment market owing to the presence of patient population, a well-developed technology, high healthcare expenditure, and the presence of the leading players. Due to the rising prevalence of diabetes, various companies, and government associations are actively participating in improving diabetes care. For instance, The Merck Foundation has provided funding of around USD 10,000,000 for the projects designed to improve diabetes care in the United States.

    Europe holds the second position in the type 2 diabetes mellitus treatment market. It is expected that the government support towards research & development expenditure and amendments in reimbursement policies in the healthcare is likely to drive the European market. As per the German maternity guidelines, every pregnant woman can undergo glucose challenge test for the early diagnosis of Gestational diabetes mellitus, and the charges for the test are completely covered by women’s health insurance.

    Asia Pacific is the fastest growing type 2 diabetes mellitus treatment market owing to a huge patient pool, increasing demand, and development in healthcare technology.

    The Middle East & Africa holds the lowest share of the global market due to low development, lack of technical knowledge, and poor medical facilities.

    Type 2 Diabetes Mellitus Treatment Market Key Players

    Some of key the players in the global type 2 diabetes mellitus treatment market are: 

    • Abbott Laboratories
    • Acon Laboratories, Inc.
    • Adocia
    • Akros Pharma
    • Amgen
    • AstraZeneca
    • Bayer AG
    • Becton 
    • Dickinson and Company
    • Biocon
    • Boehringer Ingelheim
    • Daiichi Sankyo
    • Eli Lilly
    • Merck
    • Novartis & Co.
    • Novo Nordisk
    • Peptron
    • Pfizer
    • Roche Diagnostics Ltd.
    • Sanofi
    • Sunpharma
    • Takeda Pharmaceuticals

    Intended Audience

    • Pharmaceutical Companies
    • Medical Device Companies
    • Research and Development (R&D) Companies
    • Diagnostic Laboratories
    • Government Research Institute
    • Academic Institutes and Universities

    Future Outlook

    Type 2 Diabetes Mellitus Treatment Market Future Outlook

    <p>The Type 2 Diabetes Mellitus Treatment Market is projected to grow at a 9.45% CAGR from 2024 to 2035, driven by increasing prevalence, technological advancements, and rising healthcare expenditure.</p>

    New opportunities lie in:

    • <p>Development of personalized medicine solutions for diabetes management.</p>
    • <p>Expansion of telehealth services for remote patient monitoring.</p>
    • <p>Investment in AI-driven analytics for treatment optimization.</p>

    <p>By 2035, the market is expected to achieve substantial growth, reflecting evolving treatment paradigms and increased patient engagement.</p>

    Market Segmentation

    Type 2 Diabetes Mellitus Treatment Market Devices Outlook

    • Blood Glucose Monitoring Devices
    • Insulin Delivery Devices

    Type 2 Diabetes Mellitus Treatment Market End User Outlook

    • Hospitals
    • Clinics
    • Diagnostic Centers
    • Drug Stores
    • Pharmacies
    • Others

    Type 2 Diabetes Mellitus Treatment Market Treatment Outlook

    • Drug Class
    • Devices

    Type 2 Diabetes Mellitus Treatment Market Drug Class Outlook

    • Insulin
    • Sensitizers
    • SGLT-2 Inhibitors
    • Alpha-Glucosidase Inhibitors
    • Secretagogues
    • Peptide Analogs
    • Others

    Report Scope

    MARKET SIZE 202418.86(USD Billion)
    MARKET SIZE 202520.64(USD Billion)
    MARKET SIZE 203550.92(USD Billion)
    COMPOUND ANNUAL GROWTH RATE (CAGR)9.45% (2024 - 2035)
    REPORT COVERAGERevenue Forecast, Competitive Landscape, Growth Factors, and Trends
    BASE YEAR2024
    Market Forecast Period2025 - 2035
    Historical Data2019 - 2024
    Market Forecast UnitsUSD Billion
    Key Companies ProfiledMarket analysis in progress
    Segments CoveredMarket segmentation analysis in progress
    Key Market OpportunitiesIntegration of digital health solutions enhances patient engagement in the Type 2 Diabetes Mellitus Treatment Market.
    Key Market DynamicsRising prevalence of Type 2 Diabetes Mellitus drives demand for innovative treatment options and competitive market strategies.
    Countries CoveredNorth America, Europe, APAC, South America, MEA

    FAQs

    1. SECTION I: EXECUTIVE SUMMARY AND KEY HIGHLIGHTS
      1. | 1.1 EXECUTIVE SUMMARY
      2. | | 1.1.1 Market Overview
      3. | | 1.1.2 Key Findings
      4. | | 1.1.3 Market Segmentation
      5. | | 1.1.4 Competitive Landscape
      6. | | 1.1.5 Challenges and Opportunities
      7. | | 1.1.6 Future Outlook
    2. SECTION II: SCOPING, METHODOLOGY AND MARKET STRUCTURE
      1. | 2.1 MARKET INTRODUCTION
      2. | | 2.1.1 Definition
      3. | | 2.1.2 Scope of the study
      4. | | | 2.1.2.1 Research Objective
      5. | | | 2.1.2.2 Assumption
      6. | | | 2.1.2.3 Limitations
      7. | 2.2 RESEARCH METHODOLOGY
      8. | | 2.2.1 Overview
      9. | | 2.2.2 Data Mining
      10. | | 2.2.3 Secondary Research
      11. | | 2.2.4 Primary Research
      12. | | | 2.2.4.1 Primary Interviews and Information Gathering Process
      13. | | | 2.2.4.2 Breakdown of Primary Respondents
      14. | | 2.2.5 Forecasting Model
      15. | | 2.2.6 Market Size Estimation
      16. | | | 2.2.6.1 Bottom-Up Approach
      17. | | | 2.2.6.2 Top-Down Approach
      18. | | 2.2.7 Data Triangulation
      19. | | 2.2.8 Validation
    3. SECTION III: QUALITATIVE ANALYSIS
      1. | 3.1 MARKET DYNAMICS
      2. | | 3.1.1 Overview
      3. | | 3.1.2 Drivers
      4. | | 3.1.3 Restraints
      5. | | 3.1.4 Opportunities
      6. | 3.2 MARKET FACTOR ANALYSIS
      7. | | 3.2.1 Value chain Analysis
      8. | | 3.2.2 Porter's Five Forces Analysis
      9. | | | 3.2.2.1 Bargaining Power of Suppliers
      10. | | | 3.2.2.2 Bargaining Power of Buyers
      11. | | | 3.2.2.3 Threat of New Entrants
      12. | | | 3.2.2.4 Threat of Substitutes
      13. | | | 3.2.2.5 Intensity of Rivalry
      14. | | 3.2.3 COVID-19 Impact Analysis
      15. | | | 3.2.3.1 Market Impact Analysis
      16. | | | 3.2.3.2 Regional Impact
      17. | | | 3.2.3.3 Opportunity and Threat Analysis
    4. SECTION IV: QUANTITATIVE ANALYSIS
      1. | 4.1 Healthcare, BY Treatment (USD Billion)
      2. | | 4.1.1 Drug Class
      3. | | 4.1.2 Devices
      4. | 4.2 Healthcare, BY Drug Class (USD Billion)
      5. | | 4.2.1 Insulin
      6. | | 4.2.2 Sensitizers
      7. | | 4.2.3 SGLT-2 Inhibitors
      8. | | 4.2.4 Alpha-Glucosidase Inhibitors
      9. | | 4.2.5 Secretagogues
      10. | | 4.2.6 Peptide Analogs
      11. | | 4.2.7 Others
      12. | 4.3 Healthcare, BY Devices (USD Billion)
      13. | | 4.3.1 Blood Glucose Monitoring Devices
      14. | | 4.3.2 Insulin Delivery Devices
      15. | 4.4 Healthcare, BY End User (USD Billion)
      16. | | 4.4.1 Hospitals
      17. | | 4.4.2 Clinics
      18. | | 4.4.3 Diagnostic Centers
      19. | | 4.4.4 Drug Stores
      20. | | 4.4.5 Pharmacies
      21. | | 4.4.6 Others
      22. | 4.5 Healthcare, BY Region (USD Billion)
      23. | | 4.5.1 North America
      24. | | | 4.5.1.1 US
      25. | | | 4.5.1.2 Canada
      26. | | 4.5.2 Europe
      27. | | | 4.5.2.1 Germany
      28. | | | 4.5.2.2 UK
      29. | | | 4.5.2.3 France
      30. | | | 4.5.2.4 Russia
      31. | | | 4.5.2.5 Italy
      32. | | | 4.5.2.6 Spain
      33. | | | 4.5.2.7 Rest of Europe
      34. | | 4.5.3 APAC
      35. | | | 4.5.3.1 China
      36. | | | 4.5.3.2 India
      37. | | | 4.5.3.3 Japan
      38. | | | 4.5.3.4 South Korea
      39. | | | 4.5.3.5 Malaysia
      40. | | | 4.5.3.6 Thailand
      41. | | | 4.5.3.7 Indonesia
      42. | | | 4.5.3.8 Rest of APAC
      43. | | 4.5.4 South America
      44. | | | 4.5.4.1 Brazil
      45. | | | 4.5.4.2 Mexico
      46. | | | 4.5.4.3 Argentina
      47. | | | 4.5.4.4 Rest of South America
      48. | | 4.5.5 MEA
      49. | | | 4.5.5.1 GCC Countries
      50. | | | 4.5.5.2 South Africa
      51. | | | 4.5.5.3 Rest of MEA
    5. SECTION V: COMPETITIVE ANALYSIS
      1. | 5.1 Competitive Landscape
      2. | | 5.1.1 Overview
      3. | | 5.1.2 Competitive Analysis
      4. | | 5.1.3 Market share Analysis
      5. | | 5.1.4 Major Growth Strategy in the Healthcare
      6. | | 5.1.5 Competitive Benchmarking
      7. | | 5.1.6 Leading Players in Terms of Number of Developments in the Healthcare
      8. | | 5.1.7 Key developments and growth strategies
      9. | | | 5.1.7.1 New Product Launch/Service Deployment
      10. | | | 5.1.7.2 Merger & Acquisitions
      11. | | | 5.1.7.3 Joint Ventures
      12. | | 5.1.8 Major Players Financial Matrix
      13. | | | 5.1.8.1 Sales and Operating Income
      14. | | | 5.1.8.2 Major Players R&D Expenditure. 2023
      15. | 5.2 Company Profiles
      16. | | 5.2.1 Novo Nordisk (DK)
      17. | | | 5.2.1.1 Financial Overview
      18. | | | 5.2.1.2 Products Offered
      19. | | | 5.2.1.3 Key Developments
      20. | | | 5.2.1.4 SWOT Analysis
      21. | | | 5.2.1.5 Key Strategies
      22. | | 5.2.2 Sanofi (FR)
      23. | | | 5.2.2.1 Financial Overview
      24. | | | 5.2.2.2 Products Offered
      25. | | | 5.2.2.3 Key Developments
      26. | | | 5.2.2.4 SWOT Analysis
      27. | | | 5.2.2.5 Key Strategies
      28. | | 5.2.3 Boehringer Ingelheim (DE)
      29. | | | 5.2.3.1 Financial Overview
      30. | | | 5.2.3.2 Products Offered
      31. | | | 5.2.3.3 Key Developments
      32. | | | 5.2.3.4 SWOT Analysis
      33. | | | 5.2.3.5 Key Strategies
      34. | | 5.2.4 Merck & Co. (US)
      35. | | | 5.2.4.1 Financial Overview
      36. | | | 5.2.4.2 Products Offered
      37. | | | 5.2.4.3 Key Developments
      38. | | | 5.2.4.4 SWOT Analysis
      39. | | | 5.2.4.5 Key Strategies
      40. | | 5.2.5 AstraZeneca (GB)
      41. | | | 5.2.5.1 Financial Overview
      42. | | | 5.2.5.2 Products Offered
      43. | | | 5.2.5.3 Key Developments
      44. | | | 5.2.5.4 SWOT Analysis
      45. | | | 5.2.5.5 Key Strategies
      46. | | 5.2.6 Johnson & Johnson (US)
      47. | | | 5.2.6.1 Financial Overview
      48. | | | 5.2.6.2 Products Offered
      49. | | | 5.2.6.3 Key Developments
      50. | | | 5.2.6.4 SWOT Analysis
      51. | | | 5.2.6.5 Key Strategies
      52. | | 5.2.7 Eli Lilly and Company (US)
      53. | | | 5.2.7.1 Financial Overview
      54. | | | 5.2.7.2 Products Offered
      55. | | | 5.2.7.3 Key Developments
      56. | | | 5.2.7.4 SWOT Analysis
      57. | | | 5.2.7.5 Key Strategies
      58. | | 5.2.8 Pfizer (US)
      59. | | | 5.2.8.1 Financial Overview
      60. | | | 5.2.8.2 Products Offered
      61. | | | 5.2.8.3 Key Developments
      62. | | | 5.2.8.4 SWOT Analysis
      63. | | | 5.2.8.5 Key Strategies
      64. | | 5.2.9 AbbVie (US)
      65. | | | 5.2.9.1 Financial Overview
      66. | | | 5.2.9.2 Products Offered
      67. | | | 5.2.9.3 Key Developments
      68. | | | 5.2.9.4 SWOT Analysis
      69. | | | 5.2.9.5 Key Strategies
      70. | 5.3 Appendix
      71. | | 5.3.1 References
      72. | | 5.3.2 Related Reports
    6. LIST OF FIGURES
      1. | 6.1 MARKET SYNOPSIS
      2. | 6.2 NORTH AMERICA MARKET ANALYSIS
      3. | 6.3 US MARKET ANALYSIS BY TREATMENT
      4. | 6.4 US MARKET ANALYSIS BY DRUG CLASS
      5. | 6.5 US MARKET ANALYSIS BY DEVICES
      6. | 6.6 US MARKET ANALYSIS BY END USER
      7. | 6.7 CANADA MARKET ANALYSIS BY TREATMENT
      8. | 6.8 CANADA MARKET ANALYSIS BY DRUG CLASS
      9. | 6.9 CANADA MARKET ANALYSIS BY DEVICES
      10. | 6.10 CANADA MARKET ANALYSIS BY END USER
      11. | 6.11 EUROPE MARKET ANALYSIS
      12. | 6.12 GERMANY MARKET ANALYSIS BY TREATMENT
      13. | 6.13 GERMANY MARKET ANALYSIS BY DRUG CLASS
      14. | 6.14 GERMANY MARKET ANALYSIS BY DEVICES
      15. | 6.15 GERMANY MARKET ANALYSIS BY END USER
      16. | 6.16 UK MARKET ANALYSIS BY TREATMENT
      17. | 6.17 UK MARKET ANALYSIS BY DRUG CLASS
      18. | 6.18 UK MARKET ANALYSIS BY DEVICES
      19. | 6.19 UK MARKET ANALYSIS BY END USER
      20. | 6.20 FRANCE MARKET ANALYSIS BY TREATMENT
      21. | 6.21 FRANCE MARKET ANALYSIS BY DRUG CLASS
      22. | 6.22 FRANCE MARKET ANALYSIS BY DEVICES
      23. | 6.23 FRANCE MARKET ANALYSIS BY END USER
      24. | 6.24 RUSSIA MARKET ANALYSIS BY TREATMENT
      25. | 6.25 RUSSIA MARKET ANALYSIS BY DRUG CLASS
      26. | 6.26 RUSSIA MARKET ANALYSIS BY DEVICES
      27. | 6.27 RUSSIA MARKET ANALYSIS BY END USER
      28. | 6.28 ITALY MARKET ANALYSIS BY TREATMENT
      29. | 6.29 ITALY MARKET ANALYSIS BY DRUG CLASS
      30. | 6.30 ITALY MARKET ANALYSIS BY DEVICES
      31. | 6.31 ITALY MARKET ANALYSIS BY END USER
      32. | 6.32 SPAIN MARKET ANALYSIS BY TREATMENT
      33. | 6.33 SPAIN MARKET ANALYSIS BY DRUG CLASS
      34. | 6.34 SPAIN MARKET ANALYSIS BY DEVICES
      35. | 6.35 SPAIN MARKET ANALYSIS BY END USER
      36. | 6.36 REST OF EUROPE MARKET ANALYSIS BY TREATMENT
      37. | 6.37 REST OF EUROPE MARKET ANALYSIS BY DRUG CLASS
      38. | 6.38 REST OF EUROPE MARKET ANALYSIS BY DEVICES
      39. | 6.39 REST OF EUROPE MARKET ANALYSIS BY END USER
      40. | 6.40 APAC MARKET ANALYSIS
      41. | 6.41 CHINA MARKET ANALYSIS BY TREATMENT
      42. | 6.42 CHINA MARKET ANALYSIS BY DRUG CLASS
      43. | 6.43 CHINA MARKET ANALYSIS BY DEVICES
      44. | 6.44 CHINA MARKET ANALYSIS BY END USER
      45. | 6.45 INDIA MARKET ANALYSIS BY TREATMENT
      46. | 6.46 INDIA MARKET ANALYSIS BY DRUG CLASS
      47. | 6.47 INDIA MARKET ANALYSIS BY DEVICES
      48. | 6.48 INDIA MARKET ANALYSIS BY END USER
      49. | 6.49 JAPAN MARKET ANALYSIS BY TREATMENT
      50. | 6.50 JAPAN MARKET ANALYSIS BY DRUG CLASS
      51. | 6.51 JAPAN MARKET ANALYSIS BY DEVICES
      52. | 6.52 JAPAN MARKET ANALYSIS BY END USER
      53. | 6.53 SOUTH KOREA MARKET ANALYSIS BY TREATMENT
      54. | 6.54 SOUTH KOREA MARKET ANALYSIS BY DRUG CLASS
      55. | 6.55 SOUTH KOREA MARKET ANALYSIS BY DEVICES
      56. | 6.56 SOUTH KOREA MARKET ANALYSIS BY END USER
      57. | 6.57 MALAYSIA MARKET ANALYSIS BY TREATMENT
      58. | 6.58 MALAYSIA MARKET ANALYSIS BY DRUG CLASS
      59. | 6.59 MALAYSIA MARKET ANALYSIS BY DEVICES
      60. | 6.60 MALAYSIA MARKET ANALYSIS BY END USER
      61. | 6.61 THAILAND MARKET ANALYSIS BY TREATMENT
      62. | 6.62 THAILAND MARKET ANALYSIS BY DRUG CLASS
      63. | 6.63 THAILAND MARKET ANALYSIS BY DEVICES
      64. | 6.64 THAILAND MARKET ANALYSIS BY END USER
      65. | 6.65 INDONESIA MARKET ANALYSIS BY TREATMENT
      66. | 6.66 INDONESIA MARKET ANALYSIS BY DRUG CLASS
      67. | 6.67 INDONESIA MARKET ANALYSIS BY DEVICES
      68. | 6.68 INDONESIA MARKET ANALYSIS BY END USER
      69. | 6.69 REST OF APAC MARKET ANALYSIS BY TREATMENT
      70. | 6.70 REST OF APAC MARKET ANALYSIS BY DRUG CLASS
      71. | 6.71 REST OF APAC MARKET ANALYSIS BY DEVICES
      72. | 6.72 REST OF APAC MARKET ANALYSIS BY END USER
      73. | 6.73 SOUTH AMERICA MARKET ANALYSIS
      74. | 6.74 BRAZIL MARKET ANALYSIS BY TREATMENT
      75. | 6.75 BRAZIL MARKET ANALYSIS BY DRUG CLASS
      76. | 6.76 BRAZIL MARKET ANALYSIS BY DEVICES
      77. | 6.77 BRAZIL MARKET ANALYSIS BY END USER
      78. | 6.78 MEXICO MARKET ANALYSIS BY TREATMENT
      79. | 6.79 MEXICO MARKET ANALYSIS BY DRUG CLASS
      80. | 6.80 MEXICO MARKET ANALYSIS BY DEVICES
      81. | 6.81 MEXICO MARKET ANALYSIS BY END USER
      82. | 6.82 ARGENTINA MARKET ANALYSIS BY TREATMENT
      83. | 6.83 ARGENTINA MARKET ANALYSIS BY DRUG CLASS
      84. | 6.84 ARGENTINA MARKET ANALYSIS BY DEVICES
      85. | 6.85 ARGENTINA MARKET ANALYSIS BY END USER
      86. | 6.86 REST OF SOUTH AMERICA MARKET ANALYSIS BY TREATMENT
      87. | 6.87 REST OF SOUTH AMERICA MARKET ANALYSIS BY DRUG CLASS
      88. | 6.88 REST OF SOUTH AMERICA MARKET ANALYSIS BY DEVICES
      89. | 6.89 REST OF SOUTH AMERICA MARKET ANALYSIS BY END USER
      90. | 6.90 MEA MARKET ANALYSIS
      91. | 6.91 GCC COUNTRIES MARKET ANALYSIS BY TREATMENT
      92. | 6.92 GCC COUNTRIES MARKET ANALYSIS BY DRUG CLASS
      93. | 6.93 GCC COUNTRIES MARKET ANALYSIS BY DEVICES
      94. | 6.94 GCC COUNTRIES MARKET ANALYSIS BY END USER
      95. | 6.95 SOUTH AFRICA MARKET ANALYSIS BY TREATMENT
      96. | 6.96 SOUTH AFRICA MARKET ANALYSIS BY DRUG CLASS
      97. | 6.97 SOUTH AFRICA MARKET ANALYSIS BY DEVICES
      98. | 6.98 SOUTH AFRICA MARKET ANALYSIS BY END USER
      99. | 6.99 REST OF MEA MARKET ANALYSIS BY TREATMENT
      100. | 6.100 REST OF MEA MARKET ANALYSIS BY DRUG CLASS
      101. | 6.101 REST OF MEA MARKET ANALYSIS BY DEVICES
      102. | 6.102 REST OF MEA MARKET ANALYSIS BY END USER
      103. | 6.103 KEY BUYING CRITERIA OF HEALTHCARE
      104. | 6.104 RESEARCH PROCESS OF MRFR
      105. | 6.105 DRO ANALYSIS OF HEALTHCARE
      106. | 6.106 DRIVERS IMPACT ANALYSIS: HEALTHCARE
      107. | 6.107 RESTRAINTS IMPACT ANALYSIS: HEALTHCARE
      108. | 6.108 SUPPLY / VALUE CHAIN: HEALTHCARE
      109. | 6.109 HEALTHCARE, BY TREATMENT, 2024 (% SHARE)
      110. | 6.110 HEALTHCARE, BY TREATMENT, 2024 TO 2035 (USD Billion)
      111. | 6.111 HEALTHCARE, BY DRUG CLASS, 2024 (% SHARE)
      112. | 6.112 HEALTHCARE, BY DRUG CLASS, 2024 TO 2035 (USD Billion)
      113. | 6.113 HEALTHCARE, BY DEVICES, 2024 (% SHARE)
      114. | 6.114 HEALTHCARE, BY DEVICES, 2024 TO 2035 (USD Billion)
      115. | 6.115 HEALTHCARE, BY END USER, 2024 (% SHARE)
      116. | 6.116 HEALTHCARE, BY END USER, 2024 TO 2035 (USD Billion)
      117. | 6.117 BENCHMARKING OF MAJOR COMPETITORS
    7. LIST OF TABLES
      1. | 7.1 LIST OF ASSUMPTIONS
      2. | | 7.1.1
      3. | 7.2 North America MARKET SIZE ESTIMATES; FORECAST
      4. | | 7.2.1 BY TREATMENT, 2025-2035 (USD Billion)
      5. | | 7.2.2 BY DRUG CLASS, 2025-2035 (USD Billion)
      6. | | 7.2.3 BY DEVICES, 2025-2035 (USD Billion)
      7. | | 7.2.4 BY END USER, 2025-2035 (USD Billion)
      8. | 7.3 US MARKET SIZE ESTIMATES; FORECAST
      9. | | 7.3.1 BY TREATMENT, 2025-2035 (USD Billion)
      10. | | 7.3.2 BY DRUG CLASS, 2025-2035 (USD Billion)
      11. | | 7.3.3 BY DEVICES, 2025-2035 (USD Billion)
      12. | | 7.3.4 BY END USER, 2025-2035 (USD Billion)
      13. | 7.4 Canada MARKET SIZE ESTIMATES; FORECAST
      14. | | 7.4.1 BY TREATMENT, 2025-2035 (USD Billion)
      15. | | 7.4.2 BY DRUG CLASS, 2025-2035 (USD Billion)
      16. | | 7.4.3 BY DEVICES, 2025-2035 (USD Billion)
      17. | | 7.4.4 BY END USER, 2025-2035 (USD Billion)
      18. | 7.5 Europe MARKET SIZE ESTIMATES; FORECAST
      19. | | 7.5.1 BY TREATMENT, 2025-2035 (USD Billion)
      20. | | 7.5.2 BY DRUG CLASS, 2025-2035 (USD Billion)
      21. | | 7.5.3 BY DEVICES, 2025-2035 (USD Billion)
      22. | | 7.5.4 BY END USER, 2025-2035 (USD Billion)
      23. | 7.6 Germany MARKET SIZE ESTIMATES; FORECAST
      24. | | 7.6.1 BY TREATMENT, 2025-2035 (USD Billion)
      25. | | 7.6.2 BY DRUG CLASS, 2025-2035 (USD Billion)
      26. | | 7.6.3 BY DEVICES, 2025-2035 (USD Billion)
      27. | | 7.6.4 BY END USER, 2025-2035 (USD Billion)
      28. | 7.7 UK MARKET SIZE ESTIMATES; FORECAST
      29. | | 7.7.1 BY TREATMENT, 2025-2035 (USD Billion)
      30. | | 7.7.2 BY DRUG CLASS, 2025-2035 (USD Billion)
      31. | | 7.7.3 BY DEVICES, 2025-2035 (USD Billion)
      32. | | 7.7.4 BY END USER, 2025-2035 (USD Billion)
      33. | 7.8 France MARKET SIZE ESTIMATES; FORECAST
      34. | | 7.8.1 BY TREATMENT, 2025-2035 (USD Billion)
      35. | | 7.8.2 BY DRUG CLASS, 2025-2035 (USD Billion)
      36. | | 7.8.3 BY DEVICES, 2025-2035 (USD Billion)
      37. | | 7.8.4 BY END USER, 2025-2035 (USD Billion)
      38. | 7.9 Russia MARKET SIZE ESTIMATES; FORECAST
      39. | | 7.9.1 BY TREATMENT, 2025-2035 (USD Billion)
      40. | | 7.9.2 BY DRUG CLASS, 2025-2035 (USD Billion)
      41. | | 7.9.3 BY DEVICES, 2025-2035 (USD Billion)
      42. | | 7.9.4 BY END USER, 2025-2035 (USD Billion)
      43. | 7.10 Italy MARKET SIZE ESTIMATES; FORECAST
      44. | | 7.10.1 BY TREATMENT, 2025-2035 (USD Billion)
      45. | | 7.10.2 BY DRUG CLASS, 2025-2035 (USD Billion)
      46. | | 7.10.3 BY DEVICES, 2025-2035 (USD Billion)
      47. | | 7.10.4 BY END USER, 2025-2035 (USD Billion)
      48. | 7.11 Spain MARKET SIZE ESTIMATES; FORECAST
      49. | | 7.11.1 BY TREATMENT, 2025-2035 (USD Billion)
      50. | | 7.11.2 BY DRUG CLASS, 2025-2035 (USD Billion)
      51. | | 7.11.3 BY DEVICES, 2025-2035 (USD Billion)
      52. | | 7.11.4 BY END USER, 2025-2035 (USD Billion)
      53. | 7.12 Rest of Europe MARKET SIZE ESTIMATES; FORECAST
      54. | | 7.12.1 BY TREATMENT, 2025-2035 (USD Billion)
      55. | | 7.12.2 BY DRUG CLASS, 2025-2035 (USD Billion)
      56. | | 7.12.3 BY DEVICES, 2025-2035 (USD Billion)
      57. | | 7.12.4 BY END USER, 2025-2035 (USD Billion)
      58. | 7.13 APAC MARKET SIZE ESTIMATES; FORECAST
      59. | | 7.13.1 BY TREATMENT, 2025-2035 (USD Billion)
      60. | | 7.13.2 BY DRUG CLASS, 2025-2035 (USD Billion)
      61. | | 7.13.3 BY DEVICES, 2025-2035 (USD Billion)
      62. | | 7.13.4 BY END USER, 2025-2035 (USD Billion)
      63. | 7.14 China MARKET SIZE ESTIMATES; FORECAST
      64. | | 7.14.1 BY TREATMENT, 2025-2035 (USD Billion)
      65. | | 7.14.2 BY DRUG CLASS, 2025-2035 (USD Billion)
      66. | | 7.14.3 BY DEVICES, 2025-2035 (USD Billion)
      67. | | 7.14.4 BY END USER, 2025-2035 (USD Billion)
      68. | 7.15 India MARKET SIZE ESTIMATES; FORECAST
      69. | | 7.15.1 BY TREATMENT, 2025-2035 (USD Billion)
      70. | | 7.15.2 BY DRUG CLASS, 2025-2035 (USD Billion)
      71. | | 7.15.3 BY DEVICES, 2025-2035 (USD Billion)
      72. | | 7.15.4 BY END USER, 2025-2035 (USD Billion)
      73. | 7.16 Japan MARKET SIZE ESTIMATES; FORECAST
      74. | | 7.16.1 BY TREATMENT, 2025-2035 (USD Billion)
      75. | | 7.16.2 BY DRUG CLASS, 2025-2035 (USD Billion)
      76. | | 7.16.3 BY DEVICES, 2025-2035 (USD Billion)
      77. | | 7.16.4 BY END USER, 2025-2035 (USD Billion)
      78. | 7.17 South Korea MARKET SIZE ESTIMATES; FORECAST
      79. | | 7.17.1 BY TREATMENT, 2025-2035 (USD Billion)
      80. | | 7.17.2 BY DRUG CLASS, 2025-2035 (USD Billion)
      81. | | 7.17.3 BY DEVICES, 2025-2035 (USD Billion)
      82. | | 7.17.4 BY END USER, 2025-2035 (USD Billion)
      83. | 7.18 Malaysia MARKET SIZE ESTIMATES; FORECAST
      84. | | 7.18.1 BY TREATMENT, 2025-2035 (USD Billion)
      85. | | 7.18.2 BY DRUG CLASS, 2025-2035 (USD Billion)
      86. | | 7.18.3 BY DEVICES, 2025-2035 (USD Billion)
      87. | | 7.18.4 BY END USER, 2025-2035 (USD Billion)
      88. | 7.19 Thailand MARKET SIZE ESTIMATES; FORECAST
      89. | | 7.19.1 BY TREATMENT, 2025-2035 (USD Billion)
      90. | | 7.19.2 BY DRUG CLASS, 2025-2035 (USD Billion)
      91. | | 7.19.3 BY DEVICES, 2025-2035 (USD Billion)
      92. | | 7.19.4 BY END USER, 2025-2035 (USD Billion)
      93. | 7.20 Indonesia MARKET SIZE ESTIMATES; FORECAST
      94. | | 7.20.1 BY TREATMENT, 2025-2035 (USD Billion)
      95. | | 7.20.2 BY DRUG CLASS, 2025-2035 (USD Billion)
      96. | | 7.20.3 BY DEVICES, 2025-2035 (USD Billion)
      97. | | 7.20.4 BY END USER, 2025-2035 (USD Billion)
      98. | 7.21 Rest of APAC MARKET SIZE ESTIMATES; FORECAST
      99. | | 7.21.1 BY TREATMENT, 2025-2035 (USD Billion)
      100. | | 7.21.2 BY DRUG CLASS, 2025-2035 (USD Billion)
      101. | | 7.21.3 BY DEVICES, 2025-2035 (USD Billion)
      102. | | 7.21.4 BY END USER, 2025-2035 (USD Billion)
      103. | 7.22 South America MARKET SIZE ESTIMATES; FORECAST
      104. | | 7.22.1 BY TREATMENT, 2025-2035 (USD Billion)
      105. | | 7.22.2 BY DRUG CLASS, 2025-2035 (USD Billion)
      106. | | 7.22.3 BY DEVICES, 2025-2035 (USD Billion)
      107. | | 7.22.4 BY END USER, 2025-2035 (USD Billion)
      108. | 7.23 Brazil MARKET SIZE ESTIMATES; FORECAST
      109. | | 7.23.1 BY TREATMENT, 2025-2035 (USD Billion)
      110. | | 7.23.2 BY DRUG CLASS, 2025-2035 (USD Billion)
      111. | | 7.23.3 BY DEVICES, 2025-2035 (USD Billion)
      112. | | 7.23.4 BY END USER, 2025-2035 (USD Billion)
      113. | 7.24 Mexico MARKET SIZE ESTIMATES; FORECAST
      114. | | 7.24.1 BY TREATMENT, 2025-2035 (USD Billion)
      115. | | 7.24.2 BY DRUG CLASS, 2025-2035 (USD Billion)
      116. | | 7.24.3 BY DEVICES, 2025-2035 (USD Billion)
      117. | | 7.24.4 BY END USER, 2025-2035 (USD Billion)
      118. | 7.25 Argentina MARKET SIZE ESTIMATES; FORECAST
      119. | | 7.25.1 BY TREATMENT, 2025-2035 (USD Billion)
      120. | | 7.25.2 BY DRUG CLASS, 2025-2035 (USD Billion)
      121. | | 7.25.3 BY DEVICES, 2025-2035 (USD Billion)
      122. | | 7.25.4 BY END USER, 2025-2035 (USD Billion)
      123. | 7.26 Rest of South America MARKET SIZE ESTIMATES; FORECAST
      124. | | 7.26.1 BY TREATMENT, 2025-2035 (USD Billion)
      125. | | 7.26.2 BY DRUG CLASS, 2025-2035 (USD Billion)
      126. | | 7.26.3 BY DEVICES, 2025-2035 (USD Billion)
      127. | | 7.26.4 BY END USER, 2025-2035 (USD Billion)
      128. | 7.27 MEA MARKET SIZE ESTIMATES; FORECAST
      129. | | 7.27.1 BY TREATMENT, 2025-2035 (USD Billion)
      130. | | 7.27.2 BY DRUG CLASS, 2025-2035 (USD Billion)
      131. | | 7.27.3 BY DEVICES, 2025-2035 (USD Billion)
      132. | | 7.27.4 BY END USER, 2025-2035 (USD Billion)
      133. | 7.28 GCC Countries MARKET SIZE ESTIMATES; FORECAST
      134. | | 7.28.1 BY TREATMENT, 2025-2035 (USD Billion)
      135. | | 7.28.2 BY DRUG CLASS, 2025-2035 (USD Billion)
      136. | | 7.28.3 BY DEVICES, 2025-2035 (USD Billion)
      137. | | 7.28.4 BY END USER, 2025-2035 (USD Billion)
      138. | 7.29 South Africa MARKET SIZE ESTIMATES; FORECAST
      139. | | 7.29.1 BY TREATMENT, 2025-2035 (USD Billion)
      140. | | 7.29.2 BY DRUG CLASS, 2025-2035 (USD Billion)
      141. | | 7.29.3 BY DEVICES, 2025-2035 (USD Billion)
      142. | | 7.29.4 BY END USER, 2025-2035 (USD Billion)
      143. | 7.30 Rest of MEA MARKET SIZE ESTIMATES; FORECAST
      144. | | 7.30.1 BY TREATMENT, 2025-2035 (USD Billion)
      145. | | 7.30.2 BY DRUG CLASS, 2025-2035 (USD Billion)
      146. | | 7.30.3 BY DEVICES, 2025-2035 (USD Billion)
      147. | | 7.30.4 BY END USER, 2025-2035 (USD Billion)
      148. | 7.31 PRODUCT LAUNCH/PRODUCT DEVELOPMENT/APPROVAL
      149. | | 7.31.1
      150. | 7.32 ACQUISITION/PARTNERSHIP
      151. | | 7.32.1

    Type 2 Diabetes Mellitus Treatment Market Segmentation

    Market Segmentation Overview

    • Detailed segmentation data will be available in the full report
    • Comprehensive analysis by multiple parameters
    • Regional and country-level breakdowns
    • Market size forecasts by segment
    Infographic

    Free Sample Request

    Kindly complete the form below to receive a free sample of this Report

    Get Free Sample

    Customer Strories

    “I am very pleased with how market segments have been defined in a relevant way for my purposes (such as "Portable Freezers & refrigerators" and "last-mile"). In general the report is well structured. Thanks very much for your efforts.”

    Victoria Milne

    Founder
    Case Study
    Chemicals and Materials

    Compare Licence

    ×
    Features License Type
    Single User Multiuser License Enterprise User
    Price $4,950 $5,950 $7,250
    Maximum User Access Limit 1 User Upto 10 Users Unrestricted Access Throughout the Organization
    Free Customization
    Direct Access to Analyst
    Deliverable Format
    Platform Access
    Discount on Next Purchase 10% 15% 15%
    Printable Versions