Energy & Power Market Segmentation
Energy & Power By Loading Device Type (USD Million, 2025-2035)
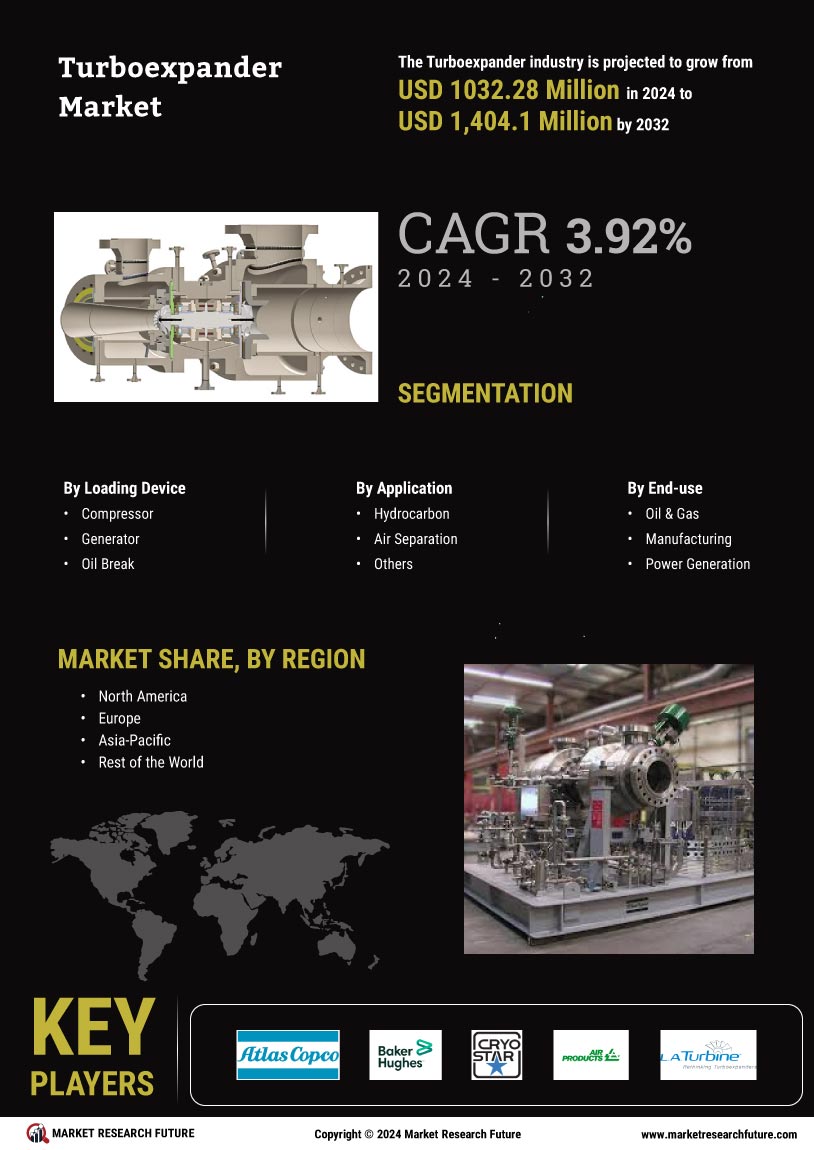
- Compressor
- Generator
- Oil Brake
Energy & Power By Application (USD Million, 2025-2035)
- Hydrocarbon
- Air Separation
- Generation of Energy from Waste Gases
- Others
Energy & Power By End-Use Industry (USD Million, 2025-2035)
- Oil and Gas
- Power Generation
- Manufacturing