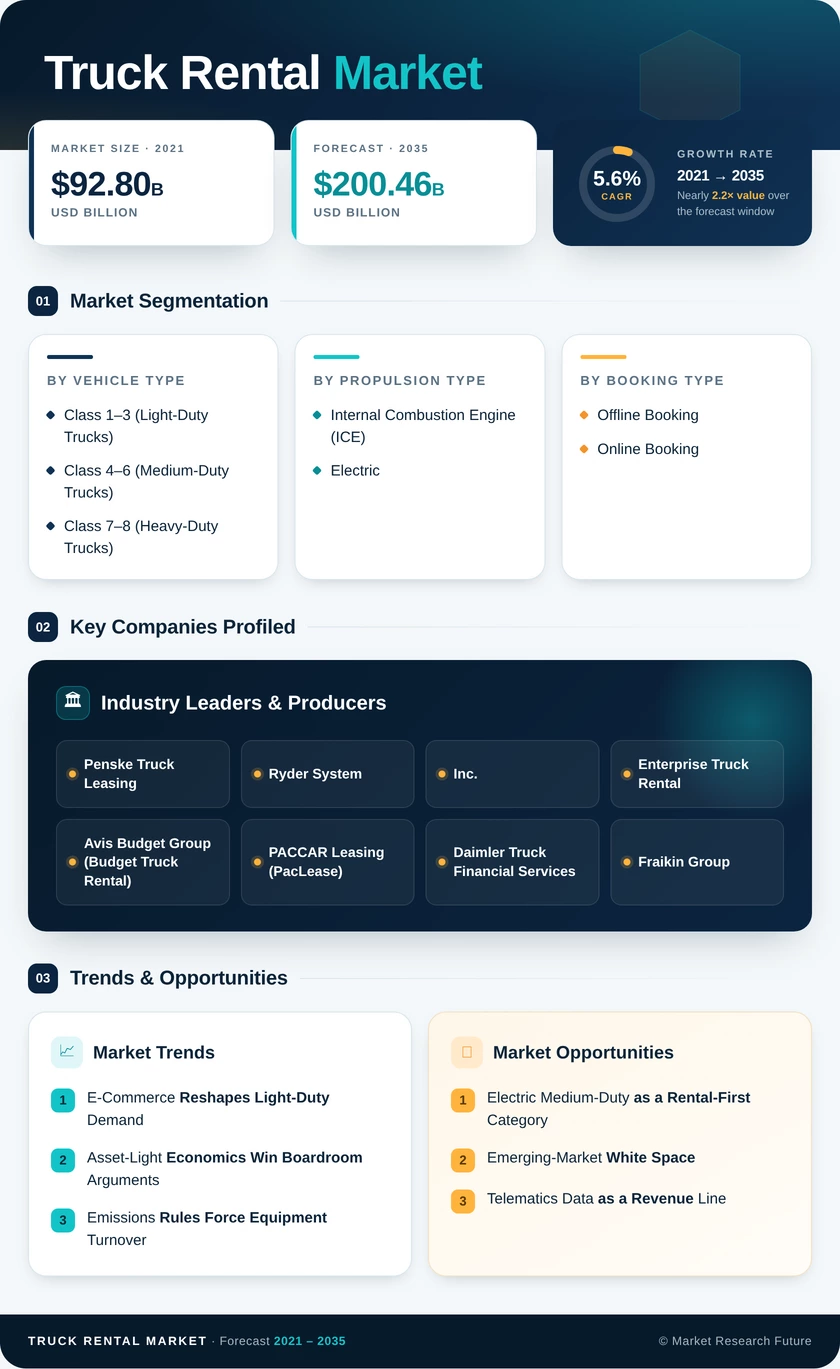
Truck Rental Market (2026 - 2035)

ID: MRFR/AT/6355-HCR 188 Pages Shubham Munde Last Updated: October 31, 2026
Truck Rental Market Research Report By Vehicle Type (Class 1–3 (Light-Duty Trucks), Class 4–6 (Medium-Duty Trucks), Class 7–8 (Heavy-Duty Trucks)), By Propulsion Type (Internal Combustion Engine (ICE), Electric), By Booking Type (Offline Booking, Online Booking), By Rental Type (Short-Term Leasing, Long-Term Leasing) - Forecast to 2035
Truck Rental Market
Market Size
Forecast Period2026-2035
CAGR (2026-2035)5.6%
2025 Market SizeUSD 116.25 Billion
2035 Market SizeUSD 200.46 Billion
Key Players
Penske Truck Leasing
Ryder System, Inc.
Enterprise Truck Rental
Avis Budget Group
PACCAR Leasing
Daimler Truck Financial Services
Opportunities
  • Electric Medium-Duty as a Rental-First Category
  • Emerging-Market White Space
  • Telematics Data as a Revenue Line
  1. 1 Market Summary | |
    1. 1.1 Study Assumptions & Market Definition | |
    2. 1.2 Scope of the Study | |
    3. 1.3 Research Methodology | |
  2. 2 Key Report Takeaways | |
    1. 2.1 By Vehicle Type | |
    2. 2.2 By Propulsion & Booking | |
    3. 2.3 By Region | |
  3. 3 Market Size & Forecast (2021–2035) | |
    1. 3.1 Historical Market Size (2021–2025) | |
    2. 3.2 Current & Forecast Market Size (2026–2035) | |
    3. 3.3 Market Size by Revenue (USD Billion) | |
    4. 3.4 Year-over-Year Growth Analysis | |
  4. 4 Driver Impact Analysis | |
    1. 4.1 E-Commerce Reshapes Light-Duty Demand | |
    2. 4.2 Asset-Light Economics Win Boardroom Arguments | |
    3. 4.3 Emissions Rules Force Equipment Turnover | |
    4. 4.4 Labor Scarcity Pushes Maintenance Outsourcing | |
  5. 5 Restraints Impact Analysis | |
    1. 5.1 Capital Costs Squeeze Fleet Renewal | |
    2. 5.2 Electric Deployment Runs Ahead of Charging | |
    3. 5.3 Insurance Pricing Erodes Operator Margin | |
  6. 6 Opportunities | |
    1. 6.1 Electric Medium-Duty as a Rental-First Category | |
    2. 6.2 Emerging-Market White Space | |
    3. 6.3 Telematics Data as a Revenue Line | |
    4. 6.4 Cross-Border and Vocational Niches | |
    5. 6.5 Subscription and Flexible-Term Products | |
    6. 6.6 Industry Value Chain Analysis | |
    7. 6.7 Porter's Five Forces Analysis | |
  7. 7 Regional Market Share & Country-Level Analysis | |
    1. 7.1 North America | | |
      1. 7.1.1 US | | |
      2. 7.1.2 Canada | | |
      3. 7.1.3 Mexico | |
    2. 7.2 Europe | | |
      1. 7.2.1 Germany | | |
      2. 7.2.2 UK | | |
      3. 7.2.3 France | | |
      4. 7.2.4 Italy | | |
      5. 7.2.5 Spain | | |
      6. 7.2.6 Nordic Countries | | |
      7. 7.2.7 Russia | | |
      8. 7.2.8 Rest of Europe | |
    3. 7.3 Asia-Pacific | | |
      1. 7.3.1 China | | |
      2. 7.3.2 India | | |
      3. 7.3.3 Japan | | |
      4. 7.3.4 South Korea | | |
      5. 7.3.5 ASEAN | | |
      6. 7.3.6 Rest of Asia-Pacific | |
    4. 7.4 South America | | |
      1. 7.4.1 Brazil | | |
      2. 7.4.2 Argentina | | |
      3. 7.4.3 Rest of South America | |
    5. 7.5 Middle East & Africa | | |
      1. 7.5.1 Saudi Arabia | | |
      2. 7.5.2 UAE | | |
      3. 7.5.3 South Africa | | |
      4. 7.5.4 Egypt | | |
      5. 7.5.5 Rest of Middle East & Africa | |
  8. 8 Future Outlook (2026–2035) | |
    1. 8.1 Autonomous Yard and Corridor Operations | |
    2. 8.2 Platform Economics Reshape Distribution | |
    3. 8.3 The Electrification Supercycle | |
    4. 8.4 Scope 3 Reporting Becomes a Sales Tool | |
  9. 9 Segmentation Analysis | |
    1. 9.1 By Vehicle Type | | |
      1. 9.1.1 Class 1–3 (Light-Duty Trucks) | | |
      2. 9.1.2 Class 4–6 (Medium-Duty Trucks) | | |
      3. 9.1.3 Class 7–8 (Heavy-Duty Trucks) | |
    2. 9.2 By Propulsion Type | | |
      1. 9.2.1 Internal Combustion Engine (ICE) | | |
      2. 9.2.2 Electric | |
    3. 9.3 By Booking Type | | |
      1. 9.3.1 Offline Booking | | |
      2. 9.3.2 Online Booking | |
    4. 9.4 By Rental Type | | |
      1. 9.4.1 Short-Term Leasing | | |
      2. 9.4.2 Long-Term Leasing | |
  10. 10 Competitive Landscape | |
    1. 10.1 Market Share Analysis (2026) | |
    2. 10.2 Competitive Benchmarking Matrix | |
    3. 10.3 Company Profiles | | |
      1. 10.3.1 Penske Truck Leasing | | |
      2. 10.3.2 Ryder System, Inc. | | |
      3. 10.3.3 U-Haul Holding Company | | |
      4. 10.3.4 Enterprise Truck Rental | | |
      5. 10.3.5 Avis Budget Group (Budget Truck Rental) | | |
      6. 10.3.6 PACCAR Leasing (PacLease) | | |
      7. 10.3.7 Daimler Truck Financial Services | | |
      8. 10.3.8 Fraikin Group | | |
      9. 10.3.9 Petit Forestier | | |
      10. 10.3.10 Ayvens (Société Générale) | | |
      11. 10.3.11 Element Fleet Management | |
  11. 11 Recent News & Developments | |
  12. 12 Report Scope & Methodology | |
    1. 12.1 Study Period & Base Year | |
    2. 12.2 Data Sources & Citations | |
    3. 12.3 Abbreviations | |
  13. 13 Detailed Sources & Citations | |
  14. 14 Frequently Asked Questions (FAQs) | | LIST OF TABLES | |
  15. TABLE 1 Global Truck Rental Market Size & Forecast, by Revenue (USD Billion), 2021–2035 | |
  16. TABLE 2 Global Truck Rental Market – Year-over-Year Growth Analysis, 2021–2035 | |
  17. TABLE 3 Driver Impact Analysis – Global Truck Rental Market, 2026–2035 | |
  18. TABLE 4 Restraint Impact Analysis – Global Truck Rental Market, 2026–2035 | |
  19. TABLE 5 Global Truck Rental Market Size, by Region, 2021–2035 (USD Billion) | |
  20. TABLE 6 North America Truck Rental Market Size, by Country, 2021–2035 (USD Billion) | |
  21. TABLE 7 Europe Truck Rental Market Size, by Country, 2021–2035 (USD Billion) | |
  22. TABLE 8 Asia-Pacific Truck Rental Market Size, by Country, 2021–2035 (USD Billion) | |
  23. TABLE 9 South America Truck Rental Market Size, by Country, 2021–2035 (USD Billion) | |
  24. TABLE 10 Middle East & Africa Truck Rental Market Size, by Country, 2021–2035 (USD Billion) | |
  25. TABLE 11 Global Truck Rental Market Size, by Vehicle Type, 2021–2035 (USD Billion) | |
  26. TABLE 12 Global Truck Rental Market Size, by Propulsion Type, 2021–2035 (USD Billion) | |
  27. TABLE 13 Global Truck Rental Market Size, by Booking Type, 2021–2035 (USD Billion) | |
  28. TABLE 14 Global Truck Rental Market Size, by Rental Type, 2021–2035 (USD Billion) | |
  29. TABLE 15 North America Truck Rental Market Size, by Vehicle Type, 2021–2035 (USD Billion) | |
  30. TABLE 16 North America Truck Rental Market Size, by Propulsion Type, 2021–2035 (USD Billion) | |
  31. TABLE 17 Europe Truck Rental Market Size, by Vehicle Type, 2021–2035 (USD Billion) | |
  32. TABLE 18 Europe Truck Rental Market Size, by Rental Type, 2021–2035 (USD Billion) | |
  33. TABLE 19 Asia-Pacific Truck Rental Market Size, by Vehicle Type, 2021–2035 (USD Billion) | |
  34. TABLE 20 Asia-Pacific Truck Rental Market Size, by Booking Type, 2021–2035 (USD Billion) | |
  35. TABLE 21 South America Truck Rental Market Size, by Vehicle Type, 2021–2035 (USD Billion) | |
  36. TABLE 22 Middle East & Africa Truck Rental Market Size, by Vehicle Type, 2021–2035 (USD Billion) | |
  37. TABLE 23 United States Truck Rental Market Size, by Segment, 2021–2035 (USD Billion) | |
  38. TABLE 24 China Truck Rental Market Size, by Segment, 2021–2035 (USD Billion) | |
  39. TABLE 25 India Truck Rental Market Size, by Segment, 2021–2035 (USD Billion) | |
  40. TABLE 26 Germany Truck Rental Market Size, by Segment, 2021–2035 (USD Billion) | |
  41. TABLE 27 Competitive Benchmarking Matrix – Global Truck Rental Market, 2026 | |
  42. TABLE 28 Company Profiles – Key Players, Global Truck Rental Market | |
  43. TABLE 29 Recent Developments & Strategic Announcements, 2023–2025 | |
  44. TABLE 30 Report Scope & Methodology Summary | |
  45. TABLE 31 Detailed Sources & Citations Index | | LIST OF FIGURES | |
  46. FIGURE 1 Global Truck Rental Market – Market Dynamics Overview (Drivers, Restraints, Opportunities) | |
  47. FIGURE 2 Global Truck Rental Market – Industry Value Chain Analysis | |
  48. FIGURE 3 Global Truck Rental Market – Porter's Five Forces Analysis | |
  49. FIGURE 4 Global Truck Rental Market Size Trend, 2021–2035 (USD Billion) | |
  50. FIGURE 5 Global Truck Rental Market – Year-over-Year Growth Trend, 2021–2035 | |
  51. FIGURE 6 Market Share by Vehicle Type, 2025 vs 2035 (%) | |
  52. FIGURE 7 Market Share by Propulsion Type, 2025 vs 2035 (%) | |
  53. FIGURE 8 Market Share by Booking Type, 2025 vs 2035 (%) | |
  54. FIGURE 9 Market Share by Rental Type, 2025 vs 2035 (%) | |
  55. FIGURE 10 Regional Revenue Share, 2025 (%) | |
  56. FIGURE 11 Regional CAGR Comparison, 2026–2035 (%) | |
  57. FIGURE 12 North America Country-Level Share, 2025 (%) | |
  58. FIGURE 13 Europe Country-Level Share, 2025 (%) | |
  59. FIGURE 14 Asia-Pacific Country-Level Share, 2025 (%) | |
  60. FIGURE 15 Competitive Landscape – Estimated Revenue Share Positioning, 2026 | |
  61. FIGURE 16 Competitive Positioning Matrix – Scale vs Service Breadth | |
  62. FIGURE 17 Electric Truck Rental Fleet Penetration Forecast, 2026–2035

Segmentation Quick Reference

DimensionSub-SegmentsDominant SegmentFastest Growing Segment
Vehicle TypeClass 1–3 (Light-Duty Trucks); Class 4–6 (Medium-Duty Trucks); Class 7–8 (Heavy-Duty Trucks)Class 1–3 (Light-Duty Trucks)Class 7–8 (Heavy-Duty Trucks)
Propulsion TypeInternal Combustion Engine (ICE); ElectricInternal Combustion Engine (ICE)Electric
Booking TypeOffline Booking; Online BookingOffline BookingOnline Booking
Rental TypeShort-Term Leasing; Long-Term LeasingLong-Term LeasingShort-Term Leasing
GeographyNorth America; Europe; Asia-Pacific; South America; Middle East & AfricaNorth AmericaAsia-Pacific


Market Segmentation Overview

By Vehicle Type

Sub-SegmentKey Trend
Class 1–3 (Light-Duty Trucks)Dual consumer and final-mile demand keeps utilization steady across seasons
Class 4–6 (Medium-Duty Trucks)Urban distribution and vocational trades drive body-configuration variety
Class 7–8 (Heavy-Duty Trucks)Carriers rent tractors to flex capacity against volatile freight cycles


Vehicle class determines both rate structure and customer profile. Lighter units turn over quickly at high volume, while heavy-duty contracts carry longer terms and deeper maintenance obligations that reward operators with national service coverage.

By Propulsion Type

Sub-SegmentKey Trend
Internal Combustion Engine (ICE)Retains the installed base but faces tightening emissions compliance costs
ElectricRental serves as the primary validation channel before purchase commitment


Propulsion mix will shift gradually rather than abruptly, gated by depot power availability more than by vehicle supply. Lessors that build charging capacity now will control a scarce asset through the 2030s.

By Booking Type

Sub-SegmentKey Trend
Offline BookingRetains enterprise accounts where relationship management and credit terms dominate
Online BookingSelf-service quoting and instant availability drive rapid share gains


Channel migration follows customer size. Small businesses and consumers move online first, while national accounts continue to transact through dedicated representatives and negotiated master agreements.

By Rental Type

Sub-SegmentKey Trend
Short-Term LeasingAbsorbs seasonal peaks, project mobilization, and breakdown substitution
Long-Term LeasingFull-service bundles convert maintenance risk into predictable per-mile cost


Term structure defines the economics of the business. Long-term contracts underwrite fleet investment with predictable utilization, while short-term inventory delivers higher day rates and captures upside when freight demand tightens.




Download PDF ×

We do not share your information with anyone. However, we may send you emails based on your report interest from time to time. You may contact us at any time to opt-out.