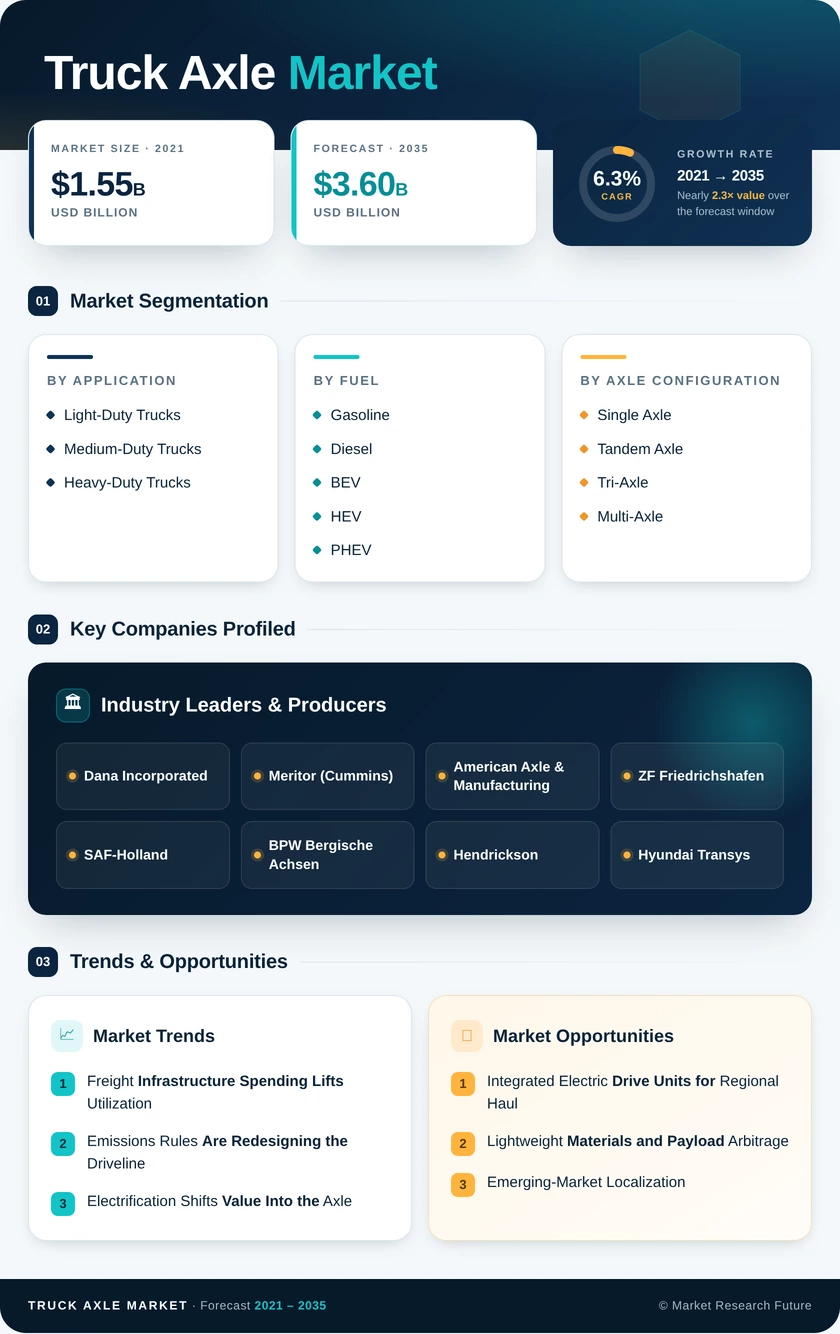
Truck Axle Market (2026 - 2035)

ID: MRFR/AT/10217-CR 188 Pages Shubham Munde Last Updated: October 16, 2026
Truck Axle Market Research Report By Application (Light-Duty Trucks, Medium-Duty Trucks, Heavy-Duty Trucks), By Fuel (Gasoline, Diesel, BEV, HEV, PHEV, FCEV), By Axle Configuration (Single Axle, Tandem Axle, Tri-Axle, Multi-Axle), By Sales Channel (OEM, Aftermarket) - Forecast to 2035
Truck Axle Market
Market Size
Forecast Period2026-2035
CAGR (2026-2035)6.3%
2025 Market SizeUSD 1.95 Billion
2035 Market SizeUSD 3.60 Billion
Key Players
Dana Incorporated
Meritor
American Axle & Manufacturing
ZF Friedrichshafen
SAF-Holland
BPW Bergische Achsen
Opportunities
  • Integrated Electric Drive Units for Regional Haul
  • Lightweight Materials and Payload Arbitrage
  • Emerging-Market Localization
  1. 1 Market Overview | |
    1. 1.1 Study Assumptions & Market Definition | |
    2. 1.2 Scope of the Study | |
    3. 1.3 Research Methodology | |
  2. 2 Market Summary & Key Report Takeaways | |
    1. 2.1 Key Takeaways by Technology | |
    2. 2.2 Key Takeaways by Sector | |
    3. 2.3 Key Takeaways by Geography | |
  3. 3 Global Market Size & Forecast (2021–2035) | |
    1. 3.1 Historical Market Size (2021–2024) | |
    2. 3.2 Base Year Assessment (2025) | |
    3. 3.3 Forecast Market Size (2026–2035) | |
    4. 3.4 Year-over-Year Growth Analysis | |
  4. 4 Market Drivers Analysis | |
    1. 4.1 Freight Infrastructure Spending Lifts Utilization | |
    2. 4.2 Emissions Rules Are Redesigning the Driveline | |
    3. 4.3 Electrification Shifts Value Into the Axle | |
    4. 4.4 Aftermarket Parc Growth Compounds Quietly | |
  5. 5 Market Restraints Analysis | |
    1. 5.1 Input Cost Swings Squeeze Thin Margins | |
    2. 5.2 Freight Cycles Delay Fleet Orders | |
    3. 5.3 Divergent Axle-Load Rules Fragment Product Design | |
  6. 6 Market Opportunity Analysis | |
    1. 6.1 Integrated Electric Drive Units for Regional Haul | |
    2. 6.2 Lightweight Materials and Payload Arbitrage | |
    3. 6.3 Emerging-Market Localization | |
    4. 6.4 Telematics-Enabled Service Monetization | |
    5. 6.5 Remanufacturing and Circular Supply | |
    6. 6.6 Industry Value Chain Analysis | |
    7. 6.7 Porter's Five Forces Analysis | |
  7. 7 Regional Market Share & Country-Level Analysis | |
    1. 7.1 North America | | |
      1. 7.1.1 US | | |
      2. 7.1.2 Canada | | |
      3. 7.1.3 Mexico | |
    2. 7.2 Europe | | |
      1. 7.2.1 Germany | | |
      2. 7.2.2 UK | | |
      3. 7.2.3 France | | |
      4. 7.2.4 Italy | | |
      5. 7.2.5 Spain | | |
      6. 7.2.6 Nordic Countries | | |
      7. 7.2.7 Russia | | |
      8. 7.2.8 Rest of Europe | |
    3. 7.3 Asia-Pacific | | |
      1. 7.3.1 China | | |
      2. 7.3.2 India | | |
      3. 7.3.3 Japan | | |
      4. 7.3.4 South Korea | | |
      5. 7.3.5 ASEAN | | |
      6. 7.3.6 Rest of Asia-Pacific | |
    4. 7.4 South America | | |
      1. 7.4.1 Brazil | | |
      2. 7.4.2 Argentina | | |
      3. 7.4.3 Rest of South America | |
    5. 7.5 Middle East & Africa | | |
      1. 7.5.1 Saudi Arabia | | |
      2. 7.5.2 UAE | | |
      3. 7.5.3 South Africa | | |
      4. 7.5.4 Egypt | | |
      5. 7.5.5 Rest of Middle East & Africa | |
  8. 8 Future Outlook (2026–2035) | |
    1. 8.1 Autonomy Raises Driveline Content | |
    2. 8.2 Electrification Reaches Cost Parity | |
    3. 8.3 Supply Chains Regionalize | |
    4. 8.4 Emissions Reporting Becomes a Procurement Filter | |
  9. 9 Segmentation Analysis | |
    1. 9.1 By Application | | |
      1. 9.1.1 Light-Duty Trucks | | |
      2. 9.1.2 Medium-Duty Trucks | | |
      3. 9.1.3 Heavy-Duty Trucks | |
    2. 9.2 By Fuel | | |
      1. 9.2.1 Gasoline | | |
      2. 9.2.2 Diesel | | |
      3. 9.2.3 BEV | | |
      4. 9.2.4 HEV | | |
      5. 9.2.5 PHEV | | |
      6. 9.2.6 FCEV | |
    3. 9.3 By Axle Configuration | | |
      1. 9.3.1 Single Axle | | |
      2. 9.3.2 Tandem Axle | | |
      3. 9.3.3 Tri-Axle | | |
      4. 9.3.4 Multi-Axle | |
    4. 9.4 By Sales Channel | | |
      1. 9.4.1 OEM | | |
      2. 9.4.2 Aftermarket | |
  10. 10 Competitive Landscape | |
    1. 10.1 Market Concentration Analysis (2026) | |
    2. 10.2 Competitive Benchmarking Matrix | |
    3. 10.3 Company Profiles | | |
      1. 10.3.1 Dana Incorporated | | |
      2. 10.3.2 Meritor (Cummins) | | |
      3. 10.3.3 American Axle & Manufacturing | | |
      4. 10.3.4 ZF Friedrichshafen | | |
      5. 10.3.5 SAF-Holland | | |
      6. 10.3.6 BPW Bergische Achsen | | |
      7. 10.3.7 Hendrickson | | |
      8. 10.3.8 Hyundai Transys | | |
      9. 10.3.9 Automotive Axles Limited | | |
      10. 10.3.10 Sisu Axles | | |
      11. 10.3.11 Benteler Automotive | |
  11. 11 Recent News & Developments (2023–2025) | |
  12. 12 Report Scope & Methodology | |
    1. 12.1 Study Period & Base Year | |
    2. 12.2 Valuation Currency & Units | |
    3. 12.3 Abbreviations | |
  13. 13 Detailed Sources & Citations | |
  14. 14 Frequently Asked Questions | | LIST OF TABLES | |
  15. TABLE 1 Global Truck Axle Market Size & Forecast, by Revenue (USD Billion), 2021–2035 | |
  16. TABLE 2 Global Truck Axle Market – Year-over-Year Growth Analysis, 2021–2035 | |
  17. TABLE 3 Driver Impact Analysis Matrix, 2026–2035 | |
  18. TABLE 4 Restraint Impact Analysis Matrix, 2026–2035 | |
  19. TABLE 5 Global Truck Axle Market Size, by Region, 2021–2035 (USD Billion) | |
  20. TABLE 6 North America Truck Axle Market Size, by Country, 2021–2035 (USD Billion) | |
  21. TABLE 7 Europe Truck Axle Market Size, by Country, 2021–2035 (USD Billion) | |
  22. TABLE 8 Asia-Pacific Truck Axle Market Size, by Country, 2021–2035 (USD Billion) | |
  23. TABLE 9 South America Truck Axle Market Size, by Country, 2021–2035 (USD Billion) | |
  24. TABLE 10 Middle East & Africa Truck Axle Market Size, by Country, 2021–2035 (USD Billion) | |
  25. TABLE 11 Global Truck Axle Market Size, by Application, 2021–2035 (USD Billion) | |
  26. TABLE 12 Global Truck Axle Market Size, by Fuel, 2021–2035 (USD Billion) | |
  27. TABLE 13 Global Truck Axle Market Size, by Axle Configuration, 2021–2035 (USD Billion) | |
  28. TABLE 14 Global Truck Axle Market Size, by Sales Channel, 2021–2035 (USD Billion) | |
  29. TABLE 15 North America Truck Axle Market Size, by Application, 2021–2035 (USD Billion) | |
  30. TABLE 16 North America Truck Axle Market Size, by Fuel, 2021–2035 (USD Billion) | |
  31. TABLE 17 Europe Truck Axle Market Size, by Axle Configuration, 2021–2035 (USD Billion) | |
  32. TABLE 18 Asia-Pacific Truck Axle Market Size, by Application, 2021–2035 (USD Billion) | |
  33. TABLE 19 Asia-Pacific Truck Axle Market Size, by Sales Channel, 2021–2035 (USD Billion) | |
  34. TABLE 20 South America Truck Axle Market Size, by Fuel, 2021–2035 (USD Billion) | |
  35. TABLE 21 Middle East & Africa Truck Axle Market Size, by Application, 2021–2035 (USD Billion) | |
  36. TABLE 22 Competitive Benchmarking Matrix – Global Truck Axle Market, 2026 | |
  37. TABLE 23 Company Profiles – Key Players, Global Truck Axle Market | |
  38. TABLE 24 Recent Developments & Strategic Announcements, 2023–2025 | |
  39. TABLE 25 Report Scope & Methodology Summary | |
  40. TABLE 26 Detailed Sources & Citations Index | | LIST OF FIGURES | |
  41. FIGURE 1 Global Truck Axle Market Dynamics – Drivers, Restraints & Opportunities | |
  42. FIGURE 2 Industry Value Chain Analysis – Truck Axle Market | |
  43. FIGURE 3 Porter's Five Forces Analysis – Truck Axle Market | |
  44. FIGURE 4 Global Truck Axle Market Size Trend, 2021–2035 (USD Billion) | |
  45. FIGURE 5 Year-over-Year Growth Trend, 2022–2035 (%) | |
  46. FIGURE 6 Market Share by Application, 2025 vs 2035 (%) | |
  47. FIGURE 7 Market Share by Fuel, 2025 vs 2035 (%) | |
  48. FIGURE 8 Market Share by Axle Configuration, 2025 (%) | |
  49. FIGURE 9 Market Share by Sales Channel, 2025 (%) | |
  50. FIGURE 10 Regional Market Share Distribution, 2025 (%) | |
  51. FIGURE 11 Regional CAGR Comparison, 2026–2035 (%) | |
  52. FIGURE 12 Country-Level Share within Asia-Pacific, 2025 (%) | |
  53. FIGURE 13 Country-Level Share within Europe, 2025 (%) | |
  54. FIGURE 14 Competitive Landscape – Revenue Share Positioning, 2026 | |
  55. FIGURE 15 Strategic Positioning Matrix – Key Suppliers | |
  56. FIGURE 16 Electrification Adoption Curve by Region, 2026–2035

Segmentation Quick Reference

DimensionSub-SegmentsDominant SegmentFastest Growing Segment
By ApplicationLight-Duty Trucks, Medium-Duty Trucks, Heavy-Duty TrucksHeavy-Duty TrucksLight-Duty Trucks
By FuelGasoline, Diesel, BEV, HEV, PHEV, FCEVDieselBEV
By Axle ConfigurationSingle Axle, Tandem Axle, Tri-Axle, Multi-AxleTandem AxleMulti-Axle
By Sales ChannelOEM, AftermarketOEMAftermarket
By GeographyNorth America, South America, Europe, Asia-Pacific, Middle East & AfricaAsia-PacificSouth America


Market Segmentation Overview

By Application

Sub-SegmentKey Trend
Light-Duty TrucksUrban parcel density drives demand for compact drive and non-drive assemblies
Medium-Duty TrucksRegional distribution fleets adopt disconnect systems for fuel savings
Heavy-Duty TrucksDownspeeding and faster ratios standardize across long-haul tractors


Application mix determines content value more than unit volume. A heavy-duty tandem set can carry four to six times the bill of materials of a light-duty rear assembly, which is why revenue concentration sits with heavy-duty even as light-duty grows faster.

By Fuel

Sub-SegmentKey Trend
GasolinePersists in North American light-duty commercial fleets
DieselRetains torque and range advantage in long-haul duty cycles
BEVIntegrated motor-gearbox-differential housings become series production standard
HEVUsed as a transitional hedge by fleets awaiting charging infrastructure
PHEVSuits mixed urban-highway routes with depot charging access
FCEVConfined to long-haul pilots in Europe, Japan and California


Fuel migration reshapes engineering priorities rather than unit counts. Electrified platforms shift thermal, NVH and torque-management responsibility onto the axle supplier, raising both technical barriers and achievable margin.

By Axle Configuration

Sub-SegmentKey Trend
Single AxleStandard for light and medium distribution vehicles
Tandem AxlePreferred for regional and long-haul tractors requiring traction balance
Tri-AxleDominant in construction, tipper and mixer applications
Multi-AxleExpanding where heavy-haul loads meet rough terrain and permit limits


Configuration choice is dictated by legal weight limits as much as engineering preference. Where regulators tighten per-axle loading, fleets add axles rather than reduce payload — a structural tailwind for tri-axle and multi-axle demand.

By Sales Channel

Sub-SegmentKey Trend
OEMLong-cycle platform contracts tied to vehicle production volumes
AftermarketAgeing parc, reman adoption and predictive maintenance subscriptions


Channel economics diverge sharply. OEM contracts deliver volume and reference credibility; the aftermarket delivers margin resilience and a revenue stream that holds when new-build orders fall.

By Region

Sub-SegmentKey Trend
North AmericaPre-buy ahead of 2027 emissions compliance pulls demand forward
South AmericaMining and agribusiness haulage sustain heavy-configuration demand
EuropeCO2 standards and toll differentiation force driveline efficiency upgrades
Asia-PacificProduction scale, localization mandates and NEV policy converge
Middle East & AfricaConstruction megaprojects and deep second-hand aftermarket


Regional demand tracks vehicle assembly location, not vehicle operation. That distinction explains why Asia-Pacific leads on share while Africa, with a large operating parc, contributes primarily through aftermarket volume.




Download PDF ×

We do not share your information with anyone. However, we may send you emails based on your report interest from time to time. You may contact us at any time to opt-out.