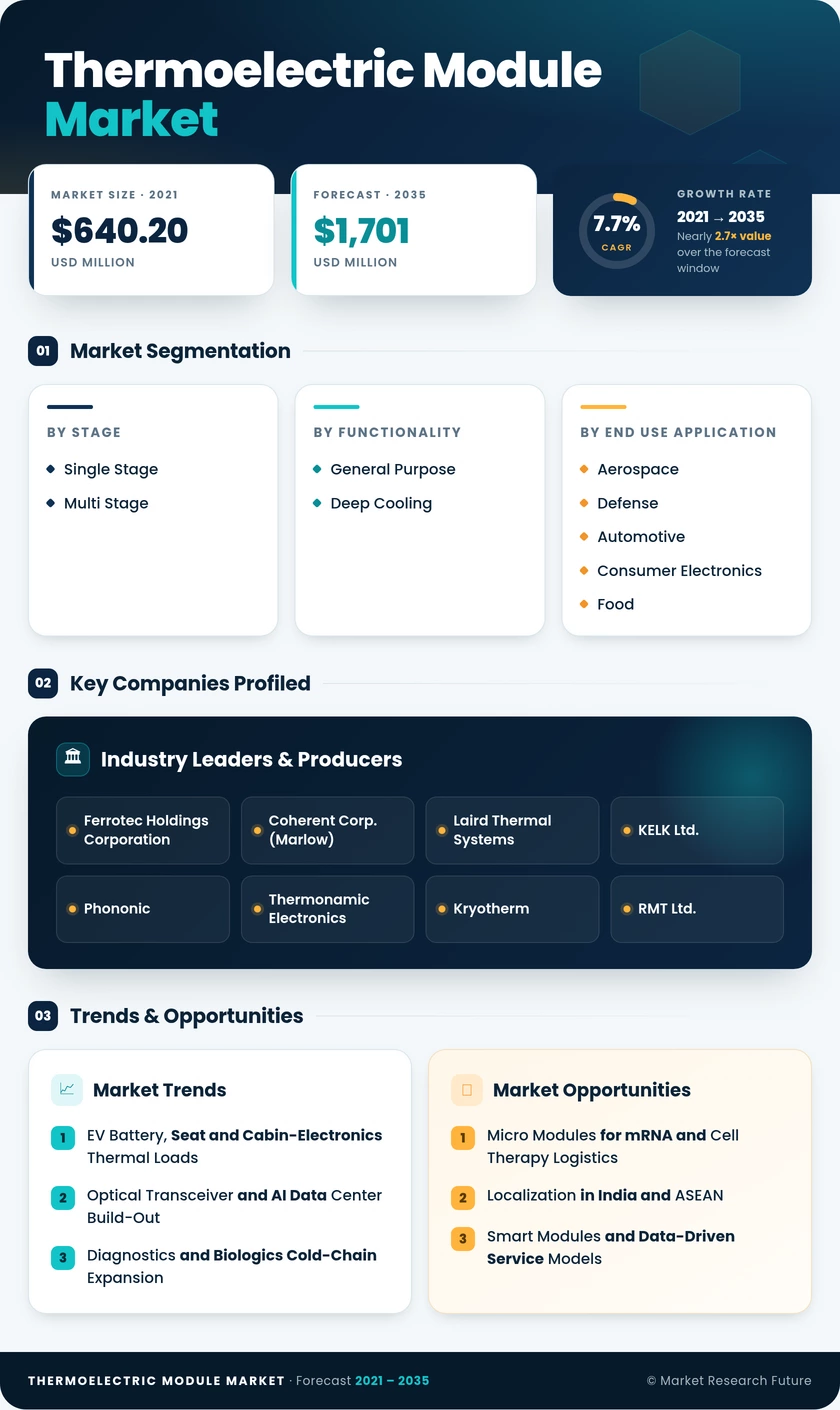
Thermoelectric Module Market (2026 - 2035)

ID: MRFR/SEM/7031-HCR 111 Pages Kiran Jinkalwad Last Updated: October 21, 2026
Thermoelectric Module Market Size, Share and Research Report By Stage (Single Stage, Multi Stage), By Functionality (General Purpose, Deep Cooling), By End Use Application (Aerospace and Defense, Automotive, Consumer Electronics, Food and Beverages, Healthcare, Energy and Utility, Refrigerant and Chillers, Other End Use Applications) and By Regional (North America, Europe, South America, Asia Pacific, Middle East and Africa) - Industry Forecast to 2035.
Thermoelectric Module Market
Market Size
Forecast Period2026-2035
CAGR (2026-2035)7.7%
2025 Market SizeUSD 812.4 Million
2035 Market SizeUSD 1,701.0 Million
Key Players
Ferrotec Holdings Corporation
Coherent Corp.
Laird Thermal Systems
KELK Ltd.
Phononic
Thermonamic Electronics
Opportunities
  • Micro Modules for mRNA and Cell Therapy Logistics
  • Localization in India and ASEAN
  • Smart Modules and Data-Driven Service Models
  1. 1 Market Summary | |
  2. 2 Key Report Takeaways | |
    1. 2.1 By Stage | |
    2. 2.2 By Functionality | |
    3. 2.3 By End Use Application | |
    4. 2.4 By Region | |
  3. 3 Market Size and Forecast (2021–2035) | |
  4. 4 Driver Impact Analysis | |
    1. 4.1 EV Battery, Seat and Cabin-Electronics Thermal Loads | |
    2. 4.2 Optical Transceiver and AI Data Center Build-Out | |
    3. 4.3 Diagnostics and Biologics Cold-Chain Expansion | |
    4. 4.4 HFC Phasedown Favoring Refrigerant-Free Cooling | |
    5. 4.5 Electronics Manufacturing Expansion | |
    6. 4.6 Defense Infrared Sensor and Avionics Cooling | |
  5. 5 Restraints Impact Analysis | |
    1. 5.1 Low Coefficient of Performance | |
    2. 5.2 Bismuth and Tellurium Supply Concentration | |
    3. 5.3 Price Erosion in Commoditized Modules | |
    4. 5.4 Competition from Alternative Thermal Technologies | |
    5. 5.5 Thermal Cycling Fatigue and Reliability Qualification | |
  6. 6 Opportunities | |
    1. 6.1 Micro Modules for mRNA and Cell Therapy Logistics | |
    2. 6.2 Localization in India and ASEAN | |
    3. 6.3 Smart Modules and Data-Driven Service Models | |
    4. 6.4 Industrial Heat-to-Power Generators | |
    5. 6.5 Next-Generation Optical Interconnects | |
  7. 7 Regional Market Share and Country-Level Analysis | |
    1. 7.1 North America | | |
      1. 7.1.1 United States | | |
      2. 7.1.2 Canada | | |
      3. 7.1.3 Mexico | |
    2. 7.2 Europe | | |
      1. 7.2.1 Germany | | |
      2. 7.2.2 United Kingdom | | |
      3. 7.2.3 France | | |
      4. 7.2.4 Italy | | |
      5. 7.2.5 Spain | | |
      6. 7.2.6 Nordic Countries | | |
      7. 7.2.7 Russia | | |
      8. 7.2.8 Rest of Europe | |
    3. 7.3 Asia-Pacific | | |
      1. 7.3.1 China | | |
      2. 7.3.2 India | | |
      3. 7.3.3 Japan | | |
      4. 7.3.4 South Korea | | |
      5. 7.3.5 ASEAN | | |
      6. 7.3.6 Rest of Asia-Pacific | |
    4. 7.4 South America | | |
      1. 7.4.1 Brazil | | |
      2. 7.4.2 Argentina | | |
      3. 7.4.3 Rest of South America | |
    5. 7.5 Middle East and Africa | | |
      1. 7.5.1 Saudi Arabia | | |
      2. 7.5.2 UAE | | |
      3. 7.5.3 South Africa | | |
      4. 7.5.4 Egypt | | |
      5. 7.5.5 Rest of MEA | |
  8. 8 Future Outlook (2026–2035) | |
    1. 8.1 AI Infrastructure and Photonic Integration | |
    2. 8.2 Electrified Mobility | |
    3. 8.3 Refrigerant Transition and Sustainability Reporting | |
    4. 8.4 Materials Innovation and Supply Security | |
  9. 9 Segmentation Analysis | |
    1. 9.1 By Stage | | |
      1. 9.1.1 Single Stage | | |
      2. 9.1.2 Multi Stage | |
    2. 9.2 By Functionality | | |
      1. 9.2.1 General Purpose | | |
      2. 9.2.2 Deep Cooling | |
    3. 9.3 By End Use Application | | |
      1. 9.3.1 Aerospace and Defense | | |
      2. 9.3.2 Automotive | | |
      3. 9.3.3 Consumer Electronics | | |
      4. 9.3.4 Food and Beverages | | |
      5. 9.3.5 Healthcare | | |
      6. 9.3.6 Energy and Utility | | |
      7. 9.3.7 Refrigerant and Chillers | | |
      8. 9.3.8 Other End Use Applications | |
  10. 10 Competitive Landscape | |
    1. 10.1 Market Concentration Analysis | |
    2. 10.2 Competitive Benchmarking Table | |
    3. 10.3 Company Profiles | | |
      1. 10.3.1 Ferrotec Holdings Corporation | | |
      2. 10.3.2 Coherent Corp. (Marlow) | | |
      3. 10.3.3 Laird Thermal Systems | | |
      4. 10.3.4 KELK Ltd. | | |
      5. 10.3.5 Phononic | | |
      6. 10.3.6 Thermonamic Electronics | | |
      7. 10.3.7 Kryotherm | | |
      8. 10.3.8 RMT Ltd. | | |
      9. 10.3.9 TE Technology | | |
      10. 10.3.10 Crystal Ltd. | | |
      11. 10.3.11 TEC Microsystems | |
  11. 11 Recent News & Developments | |
  12. 12 Report Scope and Methodology | |
  13. 13 Detailed Sources and Citations | |
  14. 14 Frequently Asked Questions (FAQs) | | LIST OF TABLES | |
  15. TABLE 1 Global Market Snapshot, 2025–2035 | |
  16. TABLE 2 Global Market Size & Forecast, by Revenue (USD Million), 2021–2035 | |
  17. TABLE 3 Driver Impact Analysis, 2026–2035 | |
  18. TABLE 4 Restraints Impact Analysis, 2026–2035 | |
  19. TABLE 5 Regional Summary, 2025 | |
  20. TABLE 6 North America Market, by Country, 2025 | |
  21. TABLE 7 Europe Market, by Country, 2025 | |
  22. TABLE 8 Asia-Pacific Market, by Country, 2025 | |
  23. TABLE 9 South America Market, by Country, 2025 | |
  24. TABLE 10 Middle East and Africa Market, by Country, 2025 | |
  25. TABLE 11 Global Market, by Stage, 2025 | |
  26. TABLE 12 Global Market, by Functionality, 2025 | |
  27. TABLE 13 Global Market, by End Use Application, 2025 | |
  28. TABLE 14 Competitive Benchmarking Table, 2025 | |
  29. TABLE 15 Report Scope and Methodology | |
  30. TABLE 16 Detailed Sources and Citations | |
  31. TABLE 17 Segmentation Quick Reference | | LIST OF FIGURES | |
  32. FIGURE 1 Market Dynamics Overview (Drivers, Restraints, Opportunities) | |
  33. FIGURE 2 Industry Value Chain Analysis | |
  34. FIGURE 3 Porter's Five Forces Analysis | |
  35. FIGURE 4 Global Market Size Trend, 2021–2035 (USD Million) | |
  36. FIGURE 5 Year-over-Year Growth Rate, 2021–2035 | |
  37. FIGURE 6 Market Share by Stage, 2025 | |
  38. FIGURE 7 Market Share by Functionality, 2025 | |
  39. FIGURE 8 Market Share by End Use Application, 2025 | |
  40. FIGURE 9 Regional Market Share, 2025 | |
  41. FIGURE 10 Regional CAGR Comparison, 2026–2035 | |
  42. FIGURE 11 Competitive Landscape: Estimated Revenue Share Ranges, 2025

Segmentation Quick Reference

DimensionSub-SegmentsDominant SegmentFastest Growing Segment
By StageSingle Stage, Multi StageSingle Stage (78.6% share)Multi Stage (8.9% CAGR)
By FunctionalityGeneral Purpose, Deep CoolingGeneral Purpose (71.3% share)Deep Cooling (8.6% CAGR)
By End Use ApplicationAerospace and Defense, Automotive, Consumer Electronics, Food and Beverages, Healthcare, Energy and Utility, Refrigerant and Chillers, Other End Use ApplicationsConsumer Electronics (22.4% share)Automotive (9.4% CAGR)
By RegionNorth America, Europe, Asia-Pacific, South America, Middle East and AfricaNorth America (34.6% share)Asia-Pacific (9.1% CAGR)

Market Segmentation Overview

By Stage

Sub-SegmentKey Trend
Single StageCost-optimized designs for automotive seats, beverage coolers and consumer accessories
Multi StageStacked architectures reaching deeper temperature differentials for infrared and scientific imaging

Single Stage leads with a 78.6% share because one layer of bismuth telluride couples handles most cooling duties at the lowest unit cost. Multi-stage grows fastest at 8.9% CAGR as infrared detectors, spectroscopy and defense seekers require cooling beyond single-layer limits. Its higher per-unit value gives it outsized influence on supplier profitability.

By Functionality

Sub-SegmentKey Trend
General PurposeHigh-volume standardized modules facing price competition from Asia-Pacific producers
Deep CoolingPrecision modules for laser stabilization, detectors and biologics storage

General Purpose holds a 71.3% share, serving portable refrigerators, dispensers and seat climate systems where price drives selection. Deep Cooling expands at 8.6% CAGR because photonics, defense and mRNA logistics buyers need stable low-temperature control backed by reliability data. Deep Cooling customers accept longer qualification cycles in exchange for proven performance.

By End Use Application

Sub-SegmentKey Trend
Aerospace and DefenseMulti-stage cooling for infrared seekers and satellite instruments
AutomotiveClimate seats, battery thermal balancing and sensor cooling on EV platforms
Consumer ElectronicsSmartphone cooling accessories, projectors and image sensors
Food and BeveragesRefrigerant-free wine coolers and portable refrigerators
HealthcarePCR thermocyclers, sample storage and medical shippers
Energy and UtilityThermoelectric generators powering remote pipeline and plant sensors
Refrigerant and ChillersSmall refrigerant-free chillers and laboratory recirculators
Other End Use ApplicationsTelecom optics, industrial lasers and scientific instruments

Consumer Electronics leads with a 22.4% share, driven by device accessories and sensor cooling produced at scale in Asia-Pacific. Automotive grows fastest at 9.4% CAGR as each EV adds seat, battery and LiDAR thermal-control points that require reversible heat pumping. Healthcare and Refrigerant and Chillers gain steadily from biologics logistics and HFC phase-down rules.


Download PDF ×

We do not share your information with anyone. However, we may send you emails based on your report interest from time to time. You may contact us at any time to opt-out.