Certified Global Research Member
Isomar fd.webp Wcrc 57.webp
Key Questions Answered
  • Global Market Outlook
  • In-depth analysis of global and regional trends
  • Analyze and identify the major players in the market, their market share, key developments, etc.
  • To understand the capability of the major players based on products offered, financials, and strategies.
  • Identify disrupting products, companies, and trends.
  • To identify opportunities in the market.
  • Analyze the key challenges in the market.
  • Analyze the regional penetration of players, products, and services in the market.
  • Comparison of major players’ financial performance.
  • Evaluate strategies adopted by major players.
  • Recommendations
Why Choose Market Research Future?
  • Vigorous research methodologies for specific market.
  • Knowledge partners across the globe
  • Large network of partner consultants.
  • Ever-increasing/ Escalating data base with quarterly monitoring of various markets
  • Trusted by fortune 500 companies/startups/ universities/organizations
  • Large database of 5000+ markets reports.
  • Effective and prompt pre- and post-sales support.

Targeted Liposomes Drug Delivery Market: By Type (
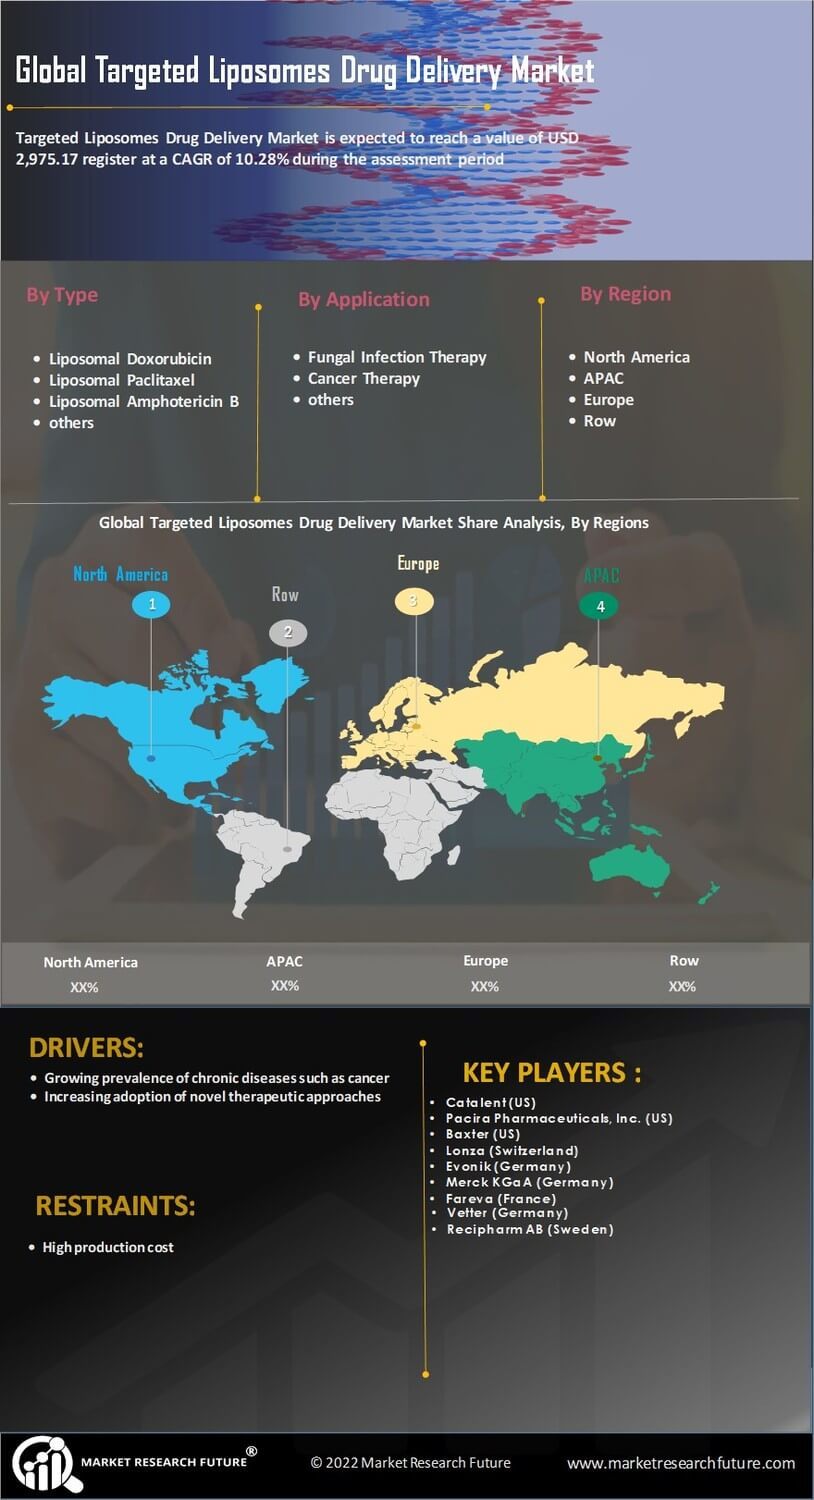
Liposomal Doxorubicin, Liposomal Paclitaxel, Liposomal Amphotericin B and others), Application (Fungal Infection Therapy, Cancer Therapy, and others) and Region (Americas, Europe, Asia-Pacific, and the Middle East & Africa) - Forecast to 2030


ID: MRFR/HC/7284-HCR | 90 Pages | Author: Kinjoll Dey| April 2024
Leading companies partner with us for data-driven Insights
client_1 client_2 client_3 client_4 client_5 client_6 client_7 client_8 client_9 client_10
Please fill in Business Email for Quick Response

Table of Contents

1. EXECUTIVE SUMMARY

1.1. Market Attractiveness Analysis

1.1.1. Global Targeted Liposomes Drug Delivery Market, by Type

1.1.2. Global Targeted Liposomes Drug Delivery Market, by Application

2. MARKET INTRODUCTION

2.1. Definition

2.2. Scope of the Study

2.3. Research Objective

2.4. Assumptions and Limitations

3. RESEARCH METHODOLOGY

3.1. Data Mining

3.2. Secondary Research

3.3. Primary Research

3.3.1. Breakdown of Primary Respondents

3.4. Forecasting Techniques

3.5. Research Methodology for Market Size Estimation

3.5.1. Bottom-Up Approach

3.5.2. Top-Down Approach

3.6. Data Triangulation

3.7. Validation

4. MARKET DYNAMICS

4.1. Overview

4.2. Drivers

4.3. Restraints

4.4. Opportunities

5. MARKET FACTOR ANALYSIS

5.1. Porter’s Five Forces Analysis

5.1.1. Bargaining Power of Suppliers

5.1.2. Bargaining Power of Buyers

5.1.3. Threat of New Entrants

5.1.4. Threat of Substitutes

5.1.5. Intensity of Rivalry

5.2. Value Chain Analysis

5.2.1. R&D and Designing

5.2.2. Manufacturing

5.2.3. Marketing, Distribution & Sales

5.2.4. Post-Sales Surveillance

6. GLOBAL TARGETED LIPOSOMES DRUG DELIVERY MARKET, BY TYPE

6.1. Overview

6.2. Liposomal doxorubicin

Market Estimates & Forecast, by Region, 2020-2027

Market Estimates & Forecast, by Country, 2020-2027

6.3. Liposomal Paclitaxel

Market Estimates & Forecast, by Region, 2020-2027

Market Estimates & Forecast, by Country, 2020-2027

6.4. Liposomal Amphotericin B

Market Estimates & Forecast, by Region, 2020-2027

Market Estimates & Forecast, by Country, 2020-2027

6.5. Others

Market Estimates & Forecast, by Region, 2020-2027

Market Estimates & Forecast, by Country, 2020-2027

7. GLOBAL TARGETED LIPOSOMES DRUG DELIVERY MARKET, BY APPLICATION

7.1. Overview

7.2. Fungal Infection Therapy

Market Estimates & Forecast, by Region, 2020-2027

Market Estimates & Forecast, by Country, 2020-2027

7.3. Cancer Therapy (Tumor Therapy)

Market Estimates & Forecast, by Region, 2020-2027

Market Estimates & Forecast, by Country, 2020-2027

7.4. Others

Market Estimates & Forecast, by Region, 2020-2027

Market Estimates & Forecast, by Country, 2020-2027

8. GLOBAL TARGETED LIPOSOMES DRUG DELIVERY MARKET, BY REGION

8.1. Overview

8.2. Americas

8.2.1. North America

8.2.1.1. US

8.2.1.2. Canada

8.2.2. Latin America

8.3. Europe

8.3.1. Western Europe

8.3.1.1. Germany

8.3.1.2. France

8.3.1.3. Italy

8.3.1.4. Spain

8.3.1.5. UK

8.3.1.6. Rest of Western Europe

8.3.2. Eastern Europe

8.4. Asia-Pacific

8.4.1. Japan

8.4.2. China

8.4.3. India

8.4.4. Australia

8.4.5. South Korea

8.4.6. Rest of Asia-Pacific

8.5. Middle East & Africa

8.5.1. Middle East

8.5.2. Africa

9. COMPETITIVE LANDSCAPE

9.1. Overview

9.2. Competitive Analysis

9.3. Market Share Analysis

9.4. Major Growth Strategy in the Global Targeted Liposomes Drug Delivery Market

9.5. Competitive Benchmarking

9.6. Leading Player in terms of Number of Developments in Global Targeted Liposomes Drug Delivery Market

9.7. Key Developments & Growth Strategies

9.7.1. New Product Launches

9.7.2. Mergers & Acquisitions

9.7.3. Joint Ventures

9.8. Major Players Financial Matrix & Market Ratio

9.8.1. Sales & Operating Income 2020

9.8.2. Major Players R&D Expenditure 2020

10. COMPANY PROFILES

10.1. Catalent

10.1.1. Company Overview

10.1.2. Products/Services Offered

10.1.3. Financial Overview

10.1.4. Key Developments

10.1.5. SWOT Analysis

10.1.6. Key Strategies

10.2. Pacira Pharmaceuticals, Inc.

10.3. Baxter

10.4. Lonza

10.5. Evonik

10.6. Merck KGaA

10.7. Fareva

10.8. Vetter

10.9. Polymun Scientific Immunbiologische Forschung GmbH

10.10. Recipharm AB

10.11. Dalton Pharma Services

10.12. Others

11. APPENDIX

11.1. References

11.2. Related Reports

LIST OF TABLES

TABLE 1 GLOBAL TARGETED LIPOSOMES DRUG DELIVERY MARKET SYNOPSIS, 2020-2027

TABLE 2 GLOBAL TARGETED LIPOSOMES DRUG DELIVERY MARKET ESTIMATES & FORECAST, 2020-2027 (USD MILLION)

TABLE 3 GLOBAL TARGETED LIPOSOMES DRUG DELIVERY MARKET, BY TYPE, 2020-2027 (USD MILLION)

TABLE 4 GLOBAL TARGETED LIPOSOMES DRUG DELIVERY MARKET, BY APPLICATION, 2020-2027 (USD MILLION)

TABLE 5 GLOBAL TARGETED LIPOSOMES DRUG DELIVERY MARKET, BY REGION, 2020-2027 (USD MILLION)

TABLE 6 NORTH AMERICA: TARGETED LIPOSOMES DRUG DELIVERY MARKET, BY TYPE, 2020-2027 (USD MILLION)

TABLE 7 NORTH AMERICA: TARGETED LIPOSOMES DRUG DELIVERY MARKET, BY APPLICATION, 2020-2027 (USD MILLION)

TABLE 8 US: TARGETED LIPOSOMES DRUG DELIVERY MARKET, BY TYPE, 2020-2027 (USD MILLION)

TABLE 9 US: TARGETED LIPOSOMES DRUG DELIVERY MARKET, BY APPLICATION, 2020-2027 (USD MILLION)

TABLE 10 CANADA: TARGETED LIPOSOMES DRUG DELIVERY MARKET, BY TYPE, 2020-2027 (USD MILLION)

TABLE 11 CANADA: TARGETED LIPOSOMES DRUG DELIVERY MARKET, BY APPLICATION, 2020-2027 (USD MILLION)

TABLE 12 LATIN AMERICA: TARGETED LIPOSOMES DRUG DELIVERY MARKET, BY TYPE, 2020-2027 (USD MILLION)

TABLE 13 LATIN AMERICA: TARGETED LIPOSOMES DRUG DELIVERY MARKET, BY APPLICATION, 2020-2027 (USD MILLION)

TABLE 14 EUROPE: TARGETED LIPOSOMES DRUG DELIVERY MARKET, BY TYPE, 2020-2027 (USD MILLION)

TABLE 15 EUROPE: TARGETED LIPOSOMES DRUG DELIVERY MARKET, BY APPLICATION, 2020-2027 (USD MILLION)

TABLE 16 WESTERN EUROPE: TARGETED LIPOSOMES DRUG DELIVERY MARKET, BY TYPE, 2020-2027 (USD MILLION)

TABLE 17 WESTERN EUROPE: TARGETED LIPOSOMES DRUG DELIVERY MARKET, BY APPLICATION, 2020-2027 (USD MILLION)

TABLE 18 EASTERN EUROPE: TARGETED LIPOSOMES DRUG DELIVERY MARKET, BY TYPE, 2020-2027 (USD MILLION)

TABLE 19 EASTERN EUROPE: TARGETED LIPOSOMES DRUG DELIVERY MARKET, BY APPLICATION, 2020-2027 (USD MILLION)

TABLE 20 ASIA-PACIFIC: TARGETED LIPOSOMES DRUG DELIVERY MARKET, BY TYPE, 2020-2027 (USD MILLION)

TABLE 21 ASIA-PACIFIC: TARGETED LIPOSOMES DRUG DELIVERY MARKET, BY APPLICATION, 2020-2027 (USD MILLION)

TABLE 22 MIDDLE EAST & AFRICA: TARGETED LIPOSOMES DRUG DELIVERY MARKET, BY TYPE, 2020-2027 (USD MILLION)

TABLE 23 MIDDLE EAST & AFRICA: TARGETED LIPOSOMES DRUG DELIVERY MARKET, BY APPLICATION, 2020-2027 (USD MILLION)

LIST OF FIGURES

FIGURE 1 RESEARCH PROCESS

FIGURE 2 MARKET STRUCTURE FOR THE GLOBAL TARGETED LIPOSOMES DRUG DELIVERY MARKET

FIGURE 3 MARKET DYNAMICS FOR THE GLOBAL TARGETED LIPOSOMES DRUG DELIVERY MARKET

FIGURE 4 GLOBAL TARGETED LIPOSOMES DRUG DELIVERY MARKET SHARE, BY TYPE, 2020 (%)

FIGURE 5 GLOBAL TARGETED LIPOSOMES DRUG DELIVERY MARKET SHARE, BY APPLICATION, 2020 (%)

FIGURE 6 GLOBAL TARGETED LIPOSOMES DRUG DELIVERY MARKET SHARE, BY REGION, 2020 (%)

FIGURE 7 AMERICAS: TARGETED LIPOSOMES DRUG DELIVERY MARKET SHARE BY REGION, 2020 (%)

FIGURE 8 NORTH AMERICA: TARGETED LIPOSOMES DRUG DELIVERY MARKET SHARE, BY COUNTRY, 2020 (%)

FIGURE 9 EUROPE: TARGETED LIPOSOMES DRUG DELIVERY MARKET SHARE, BY REGION, 2020 (%)

FIGURE 10 WESTERN EUROPE: TARGETED LIPOSOMES DRUG DELIVERY MARKET SHARE, BY COUNTRY, 2020 (%)

FIGURE 11 ASIA-PACIFIC: TARGETED LIPOSOMES DRUG DELIVERY MARKET SHARE, BY COUNTRY, 2020 (%)

FIGURE 12 MIDDLE EAST & AFRICA: TARGETED LIPOSOMES DRUG DELIVERY MARKET SHARE, BY REGION, 2020 (%)

FIGURE 13 GLOBAL TARGETED LIPOSOMES DRUG DELIVERY MARKET: COMPANY SHARE ANALYSIS, 2020 (%)

FIGURE 14 CATALENT: KEY FINANCIALS

FIGURE 15 CATALENT: SEGMENTAL REVENUE

FIGURE 16 CATALENT: REGIONAL REVENUE

FIGURE 17 PACIRA PHARMACEUTICALS, INC.: KEY FINANCIALS

FIGURE 18 PACIRA PHARMACEUTICALS, INC.: SEGMENTAL REVENUE

FIGURE 19 PACIRA PHARMACEUTICALS, INC.: REGIONAL REVENUE

FIGURE 20 BAXTER: KEY FINANCIALS

FIGURE 21 BAXTER: SEGMENTAL REVENUE

FIGURE 22 BAXTER: REGIONAL REVENUE

FIGURE 23 LONZA: KEY FINANCIALS

FIGURE 24 LONZA: SEGMENTAL REVENUE

FIGURE 25 LONZA: REGIONAL REVENUE

FIGURE 26 EVONIK: KEY FINANCIALS

FIGURE 27 EVONIK: SEGMENTAL REVENUE

FIGURE 28 EVONIK: REGIONAL REVENUE

FIGURE 29 MERCK KGAA: KEY FINANCIALS

FIGURE 30 MERCK KGAA: SEGMENTAL REVENUE

FIGURE 31 MERCK KGAA: REGIONAL REVENUE

FIGURE 32 FAREVA: KEY FINANCIALS

FIGURE 33 FAREVA: SEGMENTAL REVENUE

FIGURE 34 FAREVA: REGIONAL REVENUE

FIGURE 35 VETTER: KEY FINANCIALS

FIGURE 36 VETTER: SEGMENTAL REVENUE

FIGURE 37 VETTER: REGIONAL REVENUE

FIGURE 38 POLYMUN SCIENTIFIC IMMUNBIOLOGISCHE FORSCHUNG GMBH: KEY FINANCIALS

FIGURE 39 POLYMUN SCIENTIFIC IMMUNBIOLOGISCHE FORSCHUNG GMBH: SEGMENTAL REVENUE

FIGURE 40 POLYMUN SCIENTIFIC IMMUNBIOLOGISCHE FORSCHUNG GMBH: REGIONAL REVENUE

FIGURE 41 RECIPHARM AB: KEY FINANCIALS

FIGURE 42 RECIPHARM AB: SEGMENTAL REVENUE

FIGURE 43 RECIPHARM AB: REGIONAL REVENUE

FIGURE 44 DALTON PHARMA SERVICES: KEY FINANCIALS

FIGURE 45 DALTON PHARMA SERVICES: SEGMENTAL REVENUE

FIGURE 46 DALTON PHARMA SERVICES: REGIONAL REVENUE

Purchase Option
Single User $ 4,950
Multiuser License $ 5,950
Enterprise User $ 7,250
Compare Licenses
Tailored for You
  • Dedicated Research on any specifics segment or region.
  • Focused Research on specific players in the market.
  • Custom Report based only on your requirements.
  • Flexibility to add or subtract any chapter in the study.
  • Historic data from 2014 and forecasts outlook till 2040.
  • Flexibility of providing data/insights in formats (PDF, PPT, Excel).
  • Provide cross segmentation in applicable scenario/markets.