• Cat-intel
  • MedIntelliX
  • Resources
  • About Us
  • English
    Chinese
    French
    Japanese
    Korean
    German
    Spanish

    Tank Cleaning Chemicals Market Trends

    ID: MRFR/CnM/12509-CR
    128 Pages
    Sejal Akre
    May 2024

    Tank Cleaning Chemicals Market Research Report Information By Product (Vat Detergents, Acidic Cleaners, Pre-Solves, Odor Controllers, Specialty Products, and Others) By Tank (Chemical Tanks, Fuel Tanks, Water Transportation & Storage Tanks, Marine Tanks, Oil Tanks, Others) By End-User (Chemical, Petrochemical, Food & Beverages, Manufacturing, Marine, and Others) and By Region (North Ame...

    Share:
    Download PDF ×

    We do not share your information with anyone. However, we may send you emails based on your report interest from time to time. You may contact us at any time to opt-out.

    Tank Cleaning Chemicals Market Infographic
    $ 4,950.0
    $ 5,950.0
    $ 7,250.0

    Market Trends

    Key Emerging Trends in the Tank Cleaning Chemicals Market

    The market trends of tank cleaning chemicals are undergoing significant transformations influenced by stringent safety regulations, technological advancements, and an increasing focus on sustainability within industrial cleaning practices. One notable trend in this market is the growing demand for environmentally friendly and biodegradable tank cleaning chemicals. As industries recognize the importance of reducing environmental impact, manufacturers are developing cleaning solutions that comply with strict regulations, minimize pollution, and promote sustainability. This trend aligns with the broader industry shift towards green cleaning practices and the adoption of eco-friendly chemicals in tank cleaning applications. Moreover, there is an increasing emphasis on the development of tank cleaning chemicals with enhanced safety profiles. As worker safety remains a top priority in industrial settings, manufacturers are formulating cleaning solutions that are non-toxic, non-corrosive, and have lower volatile organic compound (VOC) content. This trend addresses concerns related to occupational health and safety, ensuring a safer working environment for personnel involved in tank cleaning operations. Customization is emerging as another key trend in the tank cleaning chemical market. Industries often face unique challenges based on the types of residues, contaminants, and materials present in tanks. Manufacturers are responding by offering customizable cleaning solutions tailored to specific industry needs. This allows users to select tank cleaning chemicals that align with the nature of the tank contents and the cleaning requirements, enhancing the effectiveness of the cleaning process. Technological advancements are playing a pivotal role in reshaping the tank cleaning chemical market. Manufacturers are incorporating advanced formulations that improve the efficiency and speed of tank cleaning processes. This includes the development of chemicals with superior degreasing and emulsifying properties, enabling faster removal of residues and contaminants. Additionally, the integration of automation and robotics in tank cleaning systems is influencing the demand for tank cleaning chemicals that are compatible with automated cleaning equipment. Furthermore, the market is witnessing a shift towards safer and more sustainable packaging options for tank cleaning chemicals. Manufacturers are exploring packaging materials that reduce the risk of spills, leaks, and exposure during transportation and storage. Sustainable packaging solutions, such as recyclable containers and reduced packaging waste, are gaining traction, reflecting the industry's commitment to responsible and environmentally conscious practices. In terms of market dynamics, competition among tank cleaning chemical manufacturers is intensifying. Companies are investing in research and development to enhance the environmental sustainability, safety features, customization, and technological advancements of their products. Meeting regulatory standards for safety and environmental impact, addressing specific industry needs, and ensuring compatibility with evolving tank cleaning technologies are critical factors for success in this competitive market. As industries increasingly prioritize effective, safe, and sustainable cleaning practices, the tank cleaning chemical market is expected to witness sustained growth and innovation.

    Market Summary

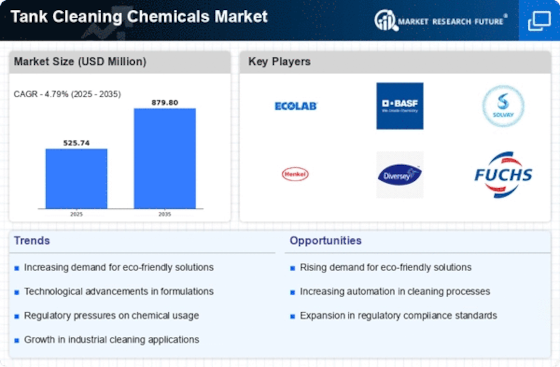
    As per Market Research Future Analysis, the Global Tank Cleaning Chemicals Market was valued at USD 525.74 Million in 2024 and is projected to grow to USD 879.80 Million by 2035, with a CAGR of 4.79% from 2025 to 2035. The growth is driven by increasing demand from the water transportation industry, which requires thorough cleaning of storage tanks to ensure safety and quality. The marine segment accounted for 35.2% of the market share in 2023, highlighting the importance of tank cleaning chemicals in maintaining operational efficiency in maritime operations. Additionally, the rise in industrialization in developing countries is further fueling market demand, particularly in sectors such as oil and gas and chemicals.

    Key Market Trends & Highlights

    Key trends influencing the Tank Cleaning Chemicals Market include:

    • Marine transportation accounts for 90% of global trade, driving demand for tank cleaning chemicals.
    • The acidic cleaners segment dominated the market with a 35.98% revenue share in 2023, expected to grow at a CAGR of 4.85%.
    • The marine tanks segment held a 39.1% market share in 2023, projected to grow at a CAGR of 5.10% from 2024 to 2032.
    • Rapid industrial growth in developing countries is increasing the need for tank cleaning to ensure compliance and operational efficiency.

    Market Size & Forecast

    2024 Market Size USD 525.74 Million
    2035 Market Size USD 879.80 Million
    CAGR (2024-2035) 4.79%

    Major Players

    CTC Chemtec Chemicals GmbH, Wilhelmsen, Star Marine Chemicals, Ecolab Inc., Ertek Chemicals, TECO Chemicals AS, Marine Care, Vecom Marine, A-One Chemicals and Equipment, Inc., Accepta.

    Market Trends

    GROWING DEMAND FOR TANK CLEANING CHEMICALS FROM MARINE TRANSPORTATION

    The growing demand for tank cleaning chemicals from marine transportation and storage tanks is a significant driver in the tank cleaning chemicals market. As the water transportation industry expands to accommodate increasing trade volumes and economic activity, vessels such as tankers, cargo ships, and barges require thorough cleaning and maintenance of their storage tanks to ensure the safety and quality of transported liquids. Marine transportation is an essential component of global trade accounting for 90% of the total trade worldwide including food, medicine, energy, and other essential items.

    According to the data released by United Nations Trade & Development, the maritime trade witnessed a growth of 2.4% in 2023 and is anticipated to further witness growth of over 2% from 2024 to 2028. Additionally, according to UNCTAD, after a decline in 2020, shipments grew by an estimated 3.2% to reach 11 billion tons, marking a significant improvement in 2021.

    This growth was observed in all developing regions, with Africa experiencing an estimated increase of 5.6%, Latin America and the Caribbean with 3%, and Asia remaining the leading maritime cargo handling center, accounting for 42% of goods loaded and 64% of goods unloaded in 2021. Thus, the rebounding of maritime cargo transportation activities has resulted in an increase in demand for tank cleaning chemicals required for tank cleaning to maintain operational efficiency and ensure the quality of stored cargo.

    Solenis, a major global producer of specialty chemicals, increased prices for all its products in North and Latin America by 10-25% on February 24, 2022, or such as allowed by agreements with customers. The primary reason behind these rises is the growing expenses of raw materials, energy, transportation and packaging. This will be seen as an exaggeration but this can lead to some businesses accumulating higher operational costs that may lead to affecting their overall cost structure and reducing investments in water treatment solutions.

    As a result, the quality of water treatment processes might suffer, raising concerns about water safety and environmental impact. Cost-effective substitutes must be found by the industry, which would not jeopardize the quality of water treatment processes.

    INCREASED INDUSTRIALIZATION IN DEVELOPING COUNTRIES

    Increased industrialization in developing countries is a significant driver of the demand for tank cleaning chemicals. As developing countries experience rapid industrial growth, there is a greater need for tank cleaning to ensure operational efficiency and compliance with regulations. Industries such as oil and gas, chemicals, and manufacturing witness substantial growth in these countries, leading to an increased demand for regular tank cleaning to maintain equipment integrity and compliance with regulations. These industries rely heavily on tanks and vessels for the storage, processing, and transportation of raw materials, intermediate products, and finished goods.

    According to the report published by BASF, the global production of chemicals is anticipated to grow by 2.4% in 2024 faster than the growth of 1.7% in 2023. Additionally, China witnessed a growth of 4% in the chemical production in 2024 compared to the previous year owing to the advancement in demand of chemicals from consumer goods and electronics in the country. Moreover, US is also anticipated to witness a growth of 1.1% compared to negative growth of -1.0% in 2023 owing to the weak industrial growth in the country.

    The increasing emphasis on environmental regulations and safety standards is driving innovation in tank cleaning chemicals, suggesting a shift towards more sustainable and efficient cleaning solutions in various industries.

    U.S. Environmental Protection Agency

    Tank Cleaning Chemicals Market Market Drivers

    Market Growth Projections

    The Global Tank Cleaning Chemicals Market Industry is poised for substantial growth, with projections indicating a market size of 525.7 USD Million in 2024 and an anticipated increase to 879.4 USD Million by 2035. This growth trajectory suggests a compound annual growth rate (CAGR) of 4.79% from 2025 to 2035. The market dynamics are influenced by various factors, including regulatory compliance, technological advancements, and the expansion of key sectors such as oil and gas. These projections highlight the evolving landscape of tank cleaning chemicals, emphasizing the need for innovative solutions that meet the demands of diverse industries.

    Growth of the Oil and Gas Sector

    The oil and gas sector remains a primary driver of the Global Tank Cleaning Chemicals Market Industry. As exploration and production activities expand globally, the need for effective tank cleaning solutions becomes increasingly critical. Companies are investing in cleaning chemicals that can handle the unique challenges posed by various types of crude oil and refined products. This sector's growth is reflected in the market's projected increase to 879.4 USD Million by 2035, highlighting the ongoing demand for specialized cleaning agents. Furthermore, the integration of advanced cleaning technologies is likely to enhance operational efficiency and safety within the industry.

    Increasing Demand for Clean Fuel Storage

    The Global Tank Cleaning Chemicals Market Industry is experiencing heightened demand for clean fuel storage solutions. As countries strive to meet stringent environmental regulations, the need for effective tank cleaning chemicals has surged. This trend is particularly evident in the oil and gas sector, where companies are investing in advanced cleaning technologies to ensure compliance and enhance operational efficiency. The market is projected to reach 525.7 USD Million in 2024, reflecting a growing recognition of the importance of maintaining clean storage facilities. This demand is likely to drive innovation in cleaning formulations and methods, further propelling market growth.

    Rising Awareness of Health and Safety Standards

    Rising awareness of health and safety standards is shaping the Global Tank Cleaning Chemicals Market Industry. Industries are increasingly recognizing the importance of maintaining safe working environments, particularly in sectors such as chemicals and food processing. This awareness drives the demand for effective tank cleaning solutions that mitigate risks associated with contamination and hazardous materials. Companies are adopting comprehensive cleaning protocols and investing in high-quality cleaning chemicals to ensure compliance with health and safety regulations. The anticipated growth of the market to 525.7 USD Million in 2024 reflects this trend, as organizations prioritize safety and operational integrity in their cleaning practices.

    Technological Advancements in Cleaning Solutions

    Technological advancements are significantly influencing the Global Tank Cleaning Chemicals Market Industry. Innovations in cleaning formulations and equipment are enhancing the efficiency and effectiveness of tank cleaning processes. For instance, the development of biodegradable and non-toxic cleaning agents is gaining traction, as industries seek sustainable alternatives to traditional chemicals. These advancements not only improve cleaning outcomes but also reduce the environmental footprint associated with tank maintenance. The projected compound annual growth rate (CAGR) of 4.79% from 2025 to 2035 indicates a robust market response to these technological innovations, as companies prioritize efficiency and sustainability in their operations.

    Regulatory Compliance and Environmental Standards

    Regulatory compliance plays a pivotal role in shaping the Global Tank Cleaning Chemicals Market Industry. Governments worldwide are implementing stringent environmental standards aimed at reducing pollution and ensuring safe handling of hazardous materials. This regulatory landscape compels industries to adopt effective tank cleaning solutions that not only meet compliance requirements but also promote sustainability. As a result, companies are increasingly investing in eco-friendly cleaning agents that minimize environmental impact. The anticipated growth of the market to 879.4 USD Million by 2035 underscores the potential for tank cleaning chemicals that align with evolving regulatory frameworks and environmental expectations.

    Market Segment Insights

    Tank Cleaning Chemicals by Product Insights

    The Tank Cleaning Chemicals Market segmentation, based on product has been segmented as Vat Detergents, Acidic Cleaners, Pre-Solves, Odor Controllers, Specialty Products, and Others. The acidic cleaners segment dominated the market with a revenue share of 35.98% in 2023 and expected to grow at CAGR of 4.85% in the forecast period. Acidic cleaners play a crucial role in the tank cleaning chemicals market, particularly in industries where mineral deposits and scale buildup are common challenges.

    These cleaners are designed to effectively remove a variety of mineral-based deposits, making them an essential tool for maintaining the cleanliness and efficiency of storage tanks. One of the primary applications of acidic cleaners is in the dairy industry. In this sector, milk stone, a combination of milk proteins and minerals, can accumulate on the surfaces of storage tanks.

    Tank Cleaning Chemicals by Tank Insights

    In 2023, the marine tanks segment held the market revenue share of 39.1% and this segment is expected to grow at a CAGR of 5.10% in the forecast period 2024-2032. Marine tanks encompass a broad category of tanks used in the maritime industry. Marine tanks, onboard ships and vessels, store various liquids such as fuel, water, and chemicals. These tanks are subject to strict regulations and guidelines to ensure the safe transportation of liquids. They require regular inspections, cleaning, and maintenance to prevent corrosion, leaks, and other potential hazards.

    Tank cleaning chemicals for marine tanks are designed to withstand harsh marine environments, effectively removing salt deposits, fuel residues, and other contaminants to prevent corrosion and maintain cargo quality during transportation.

    Tank Cleaning Chemicals by End-User Insights

    In 2023, the marine segment held the market revenue share of 35.2% and this segment is expected to grow at a CAGR of 5.02% in the forecast period 2024-2032. In the marine industry, tank cleaning chemicals are crucial for maintaining the cleanliness and integrity of tanks onboard ships and vessels. These chemicals are used to clean fuel tanks, ballast tanks, cargo tanks, and other critical components of maritime infrastructure. Tank cleaning chemicals in the marine industry are specifically formulated to remove residues such as oils, fuels, chemicals, and other substances that can accumulate in tanks during transportation or storage.

    Effective tank cleaning not only ensures the integrity of the cargo but also helps prevent cross-contamination and maintain compliance with safety and environmental regulations.

    Get more detailed insights about Tank Cleaning Chemicals Market Research Report — Global Forecast till 2032

    Regional Insights

    Based on Region, the Tank Cleaning Chemicals market is segmented into North America, Europe, Asia-Pacific, South America, and Middle East & Africa. The robust growth of the chemicals, food & beverage, and marine industries in China, India, and Japan is fueling the demand for tank cleaning chemicals. According to CEFIC, the average chemical production growth in China and India accounted for 6.9% and 1.8% respectively compared to EU, Brazil, and U.S accounting for -0.03%, -0.1%, and -0.8% respectively from 2012 to 2022.

    Additionally, according to Invest India, the food processing industry in India is one of the largest in the world with its output anticipated to reach at USD 535 billion by 2025-2026.

    Key Players and Competitive Insights

    The Tank Cleaning Chemicals Market is a highly competitive landscape characterized by intense rivalry, technological advancements, regulatory considerations, and a diverse range of players catering to various industry verticals. This dynamic environment is shaped by several key factors that influence the strategies and performances of market participants. One of the primary drivers of competition in this market is the increasing demand for efficient and environmentally friendly cleaning solutions. With stricter regulations governing industrial waste disposal and emissions, companies are compelled to innovate and develop products that not only deliver effective cleaning but also minimize environmental impact.

    This has led to a surge in research and development activities aimed at creating biodegradable, non-toxic, and sustainable cleaning chemicals.

    The major key players in the market includes CTC Chemtec Chemicals GmbH, Wilhelmsen, Star Marine Chemicals, Ecolab Inc., Ertek Chemicals, TECO Chemicals AS, Marine Care, Vecom Marine, A-One Chemicals and Equipment, Inc., and Accepta. hese companies invest significantly in research and development to create innovative cleaning formulations that meet evolving customer needs. They focus on developing environmentally friendly, biodegradable, and high-performance cleaning solutions that comply with regulatory standards while delivering superior cleaning efficacy. With a growing emphasis on sustainability and environmental stewardship, these companies prioritize eco-friendly practices in their manufacturing processes, packaging materials, and product formulations.

    They promote sustainability certifications, green labeling, and eco-labeling to demonstrate their commitment to environmental responsibility and attract environmentally conscious customers. Kemira announced an expansion of its ferric sulfate water treatment chemicals production plant in Goole, UK, in November 2023. In order to meet a part of that demand increase driven by stricter Asset Management Plan (AMP) 7&8 regulations regarding phosphorus and other nutrient discharge from wastewater treatment facilities contained in the Water Industry National Environment Programme (WINEP) in the UK Coagulant product supply has been augmented with additional investment by almost 70k tons.

    This development allows for a broader spectrum of chemicals used for purifying water supplies thereby facilitating growth within this sector.

    CTC Chemtec Chemicals GmbH: CTC Chemtec Chemicals GmbH's success in the cleaning chemicals industry is underpinned by key strategies that have solidified its position as a global leader in tank cleaning solutions. The company's ISO 9001, 14001, and 45001 certifications serve as a testament to its unwavering dedication to producing high-quality products and delivering reliable services to clients worldwide. By investing in quality management systems and continuous employee training, CTC Chemtec Chemicals GmbH ensures that its products meet the highest standards of excellence.

    CTC Chemtec Chemicals GmbH's expansive global reach and robust supply chain infrastructure enable it to supply original tank cleaning chemicals to clients across the world. This extensive network has contributed to the company's reputation as a major global supplier of cleaning chemicals, built on a foundation of trust, reliability, and exceptional service. With a strong emphasis on customer satisfaction and a culture of innovation, CTC Chemtec Chemicals GmbH remains at the forefront of the industry.

    By prioritizing the needs of its clients and staying ahead of market trends through continuous research and development, the company ensures that its products and services consistently exceed expectations.

    Star Marine Chemicals: Star Marine Chemicals prioritizes safety and quality by ensuring that most of its products carry the IMO (International Maritime Organization) certification, guaranteeing adherence to international maritime safety standards. The company's dedication to continuous improvement and innovation is evident through its substantial investments in research and development. By staying at the forefront of technology and product development, Star Marine Chemicals can introduce new and advanced solutions that cater to the changing requirements of its customers.

    This commitment to innovation not only drives the company's growth but also enables it to provide cutting-edge products that enhance maritime safety and efficiency. 

    Key Companies in the Tank Cleaning Chemicals Market market include

    Industry Developments

    February  2023: CTC Chemtec Chemicals GmbH successfully expanded its business fields by venturing into professional cleaning agents for industrial and tanker cleaning. The company secured its first customer in the tanker interior cleaning sector, welcoming TWS Truck Wash GmbH & Co. KG from Hamburg as a valued partner. TWS Truck Wash GmbH & Co. KG specializes in cleaning food residues like cocoa butter, chocolate, gluten, palm oils, and fatty acids. This strategic collaboration marks a significant milestone for CTC Chemtec Chemicals GmbH, as it diversifies its product offerings and strengthens its presence in the cleaning industry.

    April 2023: Marine Care, a global leader in tank cleaning solutions, announced today that the construction of its new production facility in Rotterdam has reached a major milestone. The bulk storage tanks, a crucial component of the facility, have been successfully placed, marking a significant step forward in the project's progress. In October 2023, CedarChem LLC was purchased by Solenis – a leading supplier of specialty chemicals for water-intensive industries. The main market for these products is industrial and municipal users who use them mostly in Southeastern United States.

    This acquisition is one way that Solenis serves its customers through its immediate go-to-market approach where it delivers better chemical applications as well as wastewater treatment and service solutions. In September 2022, Toray Industries, Inc. established the Toray India Water Research Center in Chennai for this purpose. R&D on the application of the Japanese company’s membrane technology will be intensified by this institute to meet rising demands for the country’s provision of treatment.

    Future Outlook

    Tank Cleaning Chemicals Market Future Outlook

    The Tank Cleaning Chemicals Market is projected to grow at a 4.79% CAGR from 2025 to 2035, driven by increasing regulatory standards and demand for eco-friendly solutions.

    New opportunities lie in:

    • Develop biodegradable cleaning agents to meet sustainability demands.
    • Invest in advanced formulations for specialized tank cleaning applications.
    • Leverage digital technologies for predictive maintenance and cleaning scheduling.

    By 2035, the market is expected to exhibit robust growth, reflecting evolving industry standards and consumer preferences.

    Market Segmentation

    Tank Cleaning Chemicals Tank Outlook

    • Chemical Tanks
    • Fuel Tanks
    • Water Transportation & Storage Tanks
    • Marine Tanks
    • Oil Tanks
    • Others

    Tank Cleaning Chemicals Product Outlook

    • Vat Detergents
    • Acidic Cleaners
    • Pre-Solves
    • Odor Controllers
    • Specialty Products
    • Others

    Tank Cleaning Chemicals End-User Outlook

    • Chemical
    • Petrochemical
    • Food & Beverages
    • Manufacturing
    • Marine
    • Others

    Tank Cleaning Chemicals Regional Outlook

    • US
    • Canada
    • Mexico

    Report Scope

    Report Attribute/Metric Details
    Market Size 2024 USD 525.74 Million
    Market Size 2035 879.80
    Compound Annual Growth Rate (CAGR) 4.79% (2025 - 2035)
    Base Year 2024
    Forecast Period 2025 - 2035
    Historical Data 2018 & 2022
    Forecast Units Value (USD Million), Volume (Kilotons)
    Report Coverage Revenue Forecast, Competitive Landscape, Growth Factors, and Trends
    Segments Covered Product, Tank, End-User, and Region
    Geographies Covered North America, Europe, Asia Pacific, South America, Middle East & Africa
    Countries Covered US, Canada, Mexico, Germany, Italy, France, Spain, UK, Denmark, Norway, Sweden, Finland, Iceland, China, India, Japan, South Korea, Bangladesh, Australia & New Zealand, Indonesia, Singapore, Saudi Arabia, Qatar, UAE, Oman, Bahrain, Kuwait, South Africa, Brazil, Argentina, Chile
    Key Companies Profiled CTC Chemtec Chemicals GmbH, Wilhelmsen, Star Marine Chemicals, Ecolab Inc., Ertek Chemicals, TECO Chemicals AS, Marine Care, Vecom Marine, A-One Chemicals and Equipment, Inc., and Accepta
    Key Market Opportunities ·       Adoption of green chemicals  
    Key Market Dynamics ·       Growing demand for tank cleaning chemicals from marine transportation  
    Market Size 2025 550.93
     

    Market Highlights

    Author

    Sejal Akre
    Senior Research Analyst

    She holds an experience of about 6+ years in market research and business consulting, working under the spectrum of information communication technology, telecommunications and semiconductor domains. aarti conceptualizes and implements a scalable business strategy and provides strategic leadership to the clients. her expertise lies in market estimation, competitive intelligence, pipeline analysis, customer assessment, etc.

    Leave a Comment

    Latest Comments

    John Doe
    john@example.com

    This is a great article! Really helped me understand the topic better.

    Posted on July 23, 2025, 10:15 AM
    Jane Smith
    jane@domain.com

    Thanks for sharing this. I’ve bookmarked it for later reference.

    Posted on July 22, 2025, 7:45 PM

    FAQs

    How much is the Tank Cleaning Chemicals Market?

    The Tank Cleaning Chemicals market is USD 499.2 Million in the year 2023.

    What is the growth rate of the Tank Cleaning Chemicals Market?

    The growth rate of the Tank Cleaning Chemicals Market 4.79%

    Which region held the largest market share in the Tank Cleaning Chemicals Market?

    Asia Pacific region held the largest market share in the Tank Cleaning Chemicals Market

    Who are the key players in the Tank Cleaning Chemicals Market?

    CTC Chemtec Chemicals GmbH, Wilhelmsen, Star Marine Chemicals, Ecolab Inc., Ertek Chemicals, TECO Chemicals AS, Marine Care, Vecom Marine, A-One Chemicals and Equipment, Inc., and Accepta

    Which product had the largest market share in the Tank Cleaning Chemicals Market?

    The Acidic cleaners product segment had the largest share in the Tank Cleaning Chemicals Market

    1. Table of Contents
    2. Executive Summary 24
    3. Market Introduction 29
      1. DEFINITION 29
      2. Scope of the Study 29
      3. RESEARCH OBJECTIVE 29
      4. MARKET STRUCTURE 30
    4. Research Methodology 31
      1. OVERVIEW 31
      2. DATA FLOW 33
        1. DATA MINING PROCESS 33
      3. PURCHASED DATABASE: 34
      4. SECONDARY SOURCES: 35
        1. SECONDARY RESEARCH DATA FLOW: 36
      5. PRIMARY RESEARCH: 37
        1. PRIMARY RESEARCH DATA FLOW: 38
        2. PRIMARY RESEARCH: NUMBER OF INTERVIEWS CONDUCTED 39
        3. PRIMARY RESEARCH: REGIONAL COVERAGE 39
      6. APPROACHES FOR MARKET SIZE ESTIMATION: 40
        1. CONSUMPTION & NET TRADE APPROACH 40
        2. REVENUE ANALYSIS APPROACH 40
      7. DATA FORECASTING 41
        1. DATA FORECASTING TECHNIQUE 41
      8. DATA MODELING 42
        1. MICROECONOMIC FACTOR ANALYSIS: 42
        2. DATA MODELING: 43
      9. TEAMS AND ANALYST CONTRIBUTION 44
    5. MARKET DYNAMICS 47
      1. INTRODUCTION 47
      2. DRIVERS 48
        1. GROWING DEMAND FOR TANK CLEANING CHEMICALS FROM MARINE TRANSPORTATION 48
        2. INCREASED INDUSTRIALIZATION IN DEVELOPING COUNTRIES 49
      3. RESTRAINTS 51
        1. STRICT GOVERNMENT REGULATIONS 51
      4. OPPORTUNITY 53
        1. ADOPTION OF GREEN CHEMICALS 53
      5. IMPACT ANALYSIS OF COVID-19 54
      6. IMPACT ANALYSIS OF RUSSIA –UKRAINE WAR 54
    6. MARKET FACTOR ANALYSIS 55
      1. SUPPLY CHAIN ANALYSIS 55
        1. RAW MATERIALS SUPPLIERS 55
      2. PORTER’S FIVE FORCES MODEL 57
        1. BARGAINING POWER OF SUPPLIERS 57
        2. BARGAINING POWER OF BUYERS 58
        3. THREAT OF NEW ENTRANTS 58
        4. THREAT OF SUBSTITUTES 58
        5. INTENSITY OF RIVALRY 58
      3. PRICING OVERVIEW, 2018-2032, (USD/TON) 59
      4. REGULATORY UPDATE 59
    7. GLOBAL TANK CLEANING CHEMICALS MARKET, BY PRODUCT 62
      1. INTRODUCTION 62
        1. VAT DETERGENTS 62
        2. ACIDIC CLEANERS 62
        3. PRE SOLVES 63
        4. ODOR CONTROLLERS 63
        5. SPECIALTY PRODUCTS 63
        6. OTHERS 63
    8. GLOBAL TANK CLEANING CHEMICALS MARKET, BY TANKS 66
      1. INTRODUCTION 66
        1. CHEMICAL TANKS 66
        2. FUEL TANKS 66
        3. WATER TRANSPORTATION & STORAGE TANKS 66
        4. MARINE TANKS 66
        5. OIL TANKS 67
        6. OTHERS 67
    9. GLOBAL TANK CLEANING CHEMICALS MARKET, BY END-USER 69
      1. INTRODUCTION 69
        1. CHEMICALS 69
        2. PETROCHEMICALS 69
        3. FOOD & BEVERAGES 69
        4. MANUFACTURING 70
        5. MARINE 70
        6. OTHERS 70
    10. GLOBAL TANK CLEANING CHEMICALS MARKET, BY REGION 73
      1. OVERVIEW 73
      2. NORTH AMERICA 75
        1. US 78
        2. CANADA 81
        3. MEXICO 83
      3. EUROPE 86
        1. GERMANY 90
        2. FRANCE 92
        3. UK 94
        4. SPAIN 97
        5. ITALY 99
        6. NORWAY 101
        7. NETHERLAND 104
        8. REST OF EUROPE 106
      4. ASIA-PACIFIC 109
        1. CHINA 112
        2. INDIA 115
        3. JAPAN 117
        4. SOUTH KOREA 120
        5. AUSTRALIA 122
        6. NEW ZEALAND 125
        7. THAILAND 127
        8. SINGAPORE 130
        9. REST OF ASIA PACIFIC 132
      5. MIDDLE EAST & AFRICA 135
        1. SAUDI ARABIA 138
        2. QATAR 140
        3. UAE 142
        4. OMAN 145
        5. BAHRAIN 147
        6. KUWAIT 150
        7. SOUTH AFRICA 152
        8. REST OF MIDDLE EAST & AFRICA 154
      6. SOUTH AMERICA 157
        1. BRAZIL 160
        2. ARGENTINA 162
        3. CHILE 164
        4. REST OF SOUTH AMERICA 167
    11. Competitive Landscape 171
      1. INTRODUCTION 171
      2. COMPETITION DASHBOARD 172
      3. WHO ARE THE MARKET DISRUPTORS & INNOVATORS? 173
      4. WHAT STRATEGIES ARE BEING ADOPTED BY MARKET LEADERS? 174
      5. COMPETITIVE BENCHMARKING 175
      6. LEADING PLAYERS IN TERMS OF THE NUMBER OF DEVELOPMENTS IN THE TANK CLEANING CHEMICALS MARKET 176
      7. LIST OF KEY PLAYERS, BY REGION 177
      8. COMPARATIVE ANALYSIS: KEY PLAYERS FINANCIAL, 2023 178
      9. KEY DEVELOPMENTS & GROWTH STRATEGIES 179
        1. CAPACITY EXPANSION 179
        2. ACQUISITION 180
        3. PARTNERSHIP 181
    12. COMPANY PROFILES 182
      1. CTC CHEMTEC CHEMICALS GMBH 182
        1. COMPANY OVERVIEW 182
        2. FINANCIAL OVERVIEW 182
        3. PRODUCTS OFFERED 183
        4. KEY DEVELOPMENTS 184
        5. SWOT ANALYSIS 185
        6. KEY STRATEGY 185
      2. WILHELMSEN 186
        1. COMPANY OVERVIEW 186
        2. FINANCIAL OVERVIEW 187
        3. PRODUCTS OFFERED 188
        4. KEY DEVELOPMENTS 188
        5. SWOT ANALYSIS 189
        6. KEY STRATEGY 189
      3. STAR MARINE CHEMICALS 190
        1. COMPANY OVERVIEW 190
        2. FINANCIAL OVERVIEW 190
        3. PRODUCTS OFFERED 191
        4. KEY DEVELOPMENTS 191
        5. SWOT ANALYSIS 192
        6. KEY STRATEGY 192
      4. ECOLAB INC. 193
        1. COMPANY OVERVIEW 193
        2. FINANCIAL OVERVIEW 194
        3. PRODUCTS OFFERED 195
        4. KEY DEVELOPMENTS 195
        5. SWOT ANALYSIS 196
        6. KEY STRATEGY 196
      5. ERTEK CHEMICALS 197
        1. COMPANY OVERVIEW 197
        2. FINANCIAL OVERVIEW 197
        3. PRODUCTS OFFERED 198
        4. KEY DEVELOPMENTS 198
        5. SWOT ANALYSIS 199
        6. KEY STRATEGY 199
      6. TECO CHEMICALS AS (SUBSIDIARY OF TECO MARITIME GROUP) 200
        1. COMPANY OVERVIEW 200
        2. FINANCIAL OVERVIEW 201
        3. PRODUCTS OFFERED 202
        4. KEY DEVELOPMENTS 202
        5. SWOT ANALYSIS 203
        6. KEY STRATEGY 203
      7. MARINE CARE 204
        1. COMPANY OVERVIEW 204
        2. FINANCIAL OVERVIEW 205
        3. PRODUCTS OFFERED 205
        4. KEY DEVELOPMENTS 206
        5. SWOT ANALYSIS 207
        6. KEY STRATEGY 207
      8. VECOM MARINE 208
        1. COMPANY OVERVIEW 208
        2. FINANCIAL OVERVIEW 208
        3. PRODUCTS OFFERED 209
        4. KEY DEVELOPMENTS 209
        5. SWOT ANALYSIS 210
        6. KEY STRATEGY 210
      9. ACCEPTA 211
        1. COMPANY OVERVIEW 211
        2. FINANCIAL OVERVIEW 211
        3. PRODUCTS OFFERED 212
        4. KEY DEVELOPMENTS 212
        5. SWOT ANALYSIS 212
        6. KEY STRATEGY 213
      10. A-ONE CHEMICALS AND EQUIPMENT, INC. 214
        1. COMPANY OVERVIEW 214
        2. FINANCIAL OVERVIEW 214
        3. PRODUCTS OFFERED 215
        4. KEY DEVELOPMENTS 215
        5. SWOT ANALYSIS 216
        6. KEY STRATEGY 216
      11. DATA CITATIONS 218
    13. List of Tables and Figures
      1. LIST OF TABLES
      2. TABLE 1 QFD MODELING FOR MARKET SHARE ASSESSMENT 41
      3. TABLE 2 GLOBAL TANK CLEANING CHEMICALS MARKET, PRICING ANALYSIS BY REGION, 2018-2032 (USD/TON) 57
      4. TABLE 1 GLOBAL TANK CLEANING CHEMICALS MARKET, BY PRODUCT, 2018-2032 (USD MILLION) 62
      5. TABLE 2 GLOBAL TANK CLEANING CHEMICALS MARKET, BY PRODUCT, 2018-2032 (KILO TONS) 63
      6. TABLE 3 GLOBAL TANK CLEANING CHEMICALS MARKET, BY TANK, 2018-2032 (USD MILLION) 66
      7. TABLE 4 GLOBAL TANK CLEANING CHEMICALS MARKET, BY TANK, 2018-2032 (KILO TONS) 66
      8. TABLE 5 GLOBAL TANK CLEANING CHEMICALS MARKET, BY END-USER, 2018-2032 (USD MILLION) 69
      9. TABLE 6 GLOBAL TANK CLEANING CHEMICALS MARKET, BY END-USER, 2018-2032 (KILO TONS) 70
      10. TABLE 7 GLOBAL TANK CLEANING CHEMICALS MARKET, BY REGION, 2018-2032 (USD MILLION) 71
      11. TABLE 8 GLOBAL TANK CLEANING CHEMICALS MARKET, BY REGION, 2018-2032 (KILO TONS) 71
      12. TABLE 9 NORTH AMERICA: TANK CLEANING CHEMICALS MARKET, BY COUNTRY, 2018-2032 (USD MILLION) 73
      13. TABLE 10 NORTH AMERICA: TANK CLEANING CHEMICALS MARKET, BY COUNTRY, 2018-2032 (KILO TONS) 74
      14. TABLE 11 NORTH AMERICA TANK CLEANING CHEMICALS MARKET, BY PRODUCT, 2018-2032 (USD MILLION) 74
      15. TABLE 12 NORTH AMERICA TANK CLEANING CHEMICALS MARKET, BY PRODUCT, 2018-2032 (KILO TONS) 74
      16. TABLE 13 NORTH AMERICA TANK CLEANING CHEMICALS MARKET, BY TANK, 2018-2032 (USD MILLION) 75
      17. TABLE 14 NORTH AMERICA TANK CLEANING CHEMICALS MARKET, BY TANK, 2018-2032 (KILO TONS) 75
      18. TABLE 15 NORTH AMERICA: TANK CLEANING CHEMICALS MARKET, BY END-USER, 2018-2032 (USD MILLION) 75
      19. TABLE 16 NORTH AMERICA: TANK CLEANING CHEMICALS MARKET, BY END-USER, 2018-2032 (KILO TONS) 76
      20. TABLE 17 US TANK CLEANING CHEMICALS MARKET, BY PRODUCT, 2018-2032 (USD MILLION) 76
      21. TABLE 18 US TANK CLEANING CHEMICALS MARKET, BY PRODUCT, 2018-2032 (KILO TONS) 77
      22. TABLE 19 US TANK CLEANING CHEMICALS MARKET, BY TANK, 2018-2032 (USD MILLION) 77
      23. TABLE 20 US TANK CLEANING CHEMICALS MARKET, BY TANK, 2018-2032 (KILO TONS) 77
      24. TABLE 21 US: TANK CLEANING CHEMICALS MARKET, BY END-USER, 2018-2032 (USD MILLION) 78
      25. TABLE 22 US: TANK CLEANING CHEMICALS MARKET, BY END-USER, 2018-2032 (KILO TONS) 78
      26. TABLE 23 CANADA TANK CLEANING CHEMICALS MARKET, BY PRODUCT, 2018-2032 (USD MILLION) 79
      27. TABLE 24 CANADA TANK CLEANING CHEMICALS MARKET, BY PRODUCT, 2018-2032 (KILO TONS) 79
      28. TABLE 25 CANADA TANK CLEANING CHEMICALS MARKET, BY TANK, 2018-2032 (USD MILLION) 79
      29. TABLE 26 CANADA TANK CLEANING CHEMICALS MARKET, BY TANK, 2018-2032 (KILO TONS) 80
      30. TABLE 27 CANADA: TANK CLEANING CHEMICALS MARKET, BY END-USER, 2018-2032 (USD MILLION) 80
      31. TABLE 28 CANADA: TANK CLEANING CHEMICALS MARKET, BY END-USER, 2018-2032 (KILO TONS) 80
      32. TABLE 29 MEXICO TANK CLEANING CHEMICALS MARKET, BY PRODUCT, 2018-2032 (USD MILLION) 81
      33. TABLE 30 MEXICO TANK CLEANING CHEMICALS MARKET, BY PRODUCT, 2018-2032 (KILO TONS) 81
      34. TABLE 31 MEXICO TANK CLEANING CHEMICALS MARKET, BY TANK, 2018-2032 (USD MILLION) 82
      35. TABLE 32 MEXICO TANK CLEANING CHEMICALS MARKET, BY TANK, 2018-2032 (KILO TONS) 82
      36. TABLE 33 MEXICO: TANK CLEANING CHEMICALS MARKET, BY END-USER, 2018-2032 (USD MILLION) 82
      37. TABLE 34 MEXICO: TANK CLEANING CHEMICALS MARKET, BY END-USER, 2018-2032 (KILO TONS) 83
      38. TABLE 35 EUROPE: TANK CLEANING CHEMICALS MARKET, BY COUNTRY, 2018-2032 (USD MILLION) 84
      39. TABLE 36 EUROPE: TANK CLEANING CHEMICALS MARKET, BY COUNTRY, 2018-2032 (KILO TONS) 84
      40. TABLE 37 EUROPE TANK CLEANING CHEMICALS MARKET, BY PRODUCT, 2018-2032 (USD MILLION) 85
      41. TABLE 38 EUROPE TANK CLEANING CHEMICALS MARKET, BY PRODUCT, 2018-2032 (KILO TONS) 85
      42. TABLE 39 EUROPE TANK CLEANING CHEMICALS MARKET, BY TANK, 2018-2032 (USD MILLION) 85
      43. TABLE 40 EUROPE TANK CLEANING CHEMICALS MARKET, BY TANK, 2018-2032 (KILO TONS) 86
      44. TABLE 41 EUROPE: TANK CLEANING CHEMICALS MARKET, BY END-USER, 2018-2032 (USD MILLION) 86
      45. TABLE 42 EUROPE: TANK CLEANING CHEMICALS MARKET, BY END-USER, 2018-2032 (KILO TONS) 87
      46. TABLE 43 GERMANY TANK CLEANING CHEMICALS MARKET, BY PRODUCT, 2018-2032 (USD MILLION) 88
      47. TABLE 44 GERMANY TANK CLEANING CHEMICALS MARKET, BY PRODUCT, 2018-2032 (KILO TONS) 88
      48. TABLE 45 GERMANY TANK CLEANING CHEMICALS MARKET, BY TANK, 2018-2032 (USD MILLION) 88
      49. TABLE 46 GERMANY TANK CLEANING CHEMICALS MARKET, BY TANK, 2018-2032 (KILO TONS) 89
      50. TABLE 47 GERMANY: TANK CLEANING CHEMICALS MARKET, BY END-USER, 2018-2032 (USD MILLION) 89
      51. TABLE 48 GERMANY: TANK CLEANING CHEMICALS MARKET, BY END-USER, 2018-2032 (KILO TONS) 89
      52. TABLE 49 FRANCE TANK CLEANING CHEMICALS MARKET, BY PRODUCT, 2018-2032 (USD MILLION) 90
      53. TABLE 50 FRANCE TANK CLEANING CHEMICALS MARKET, BY PRODUCT, 2018-2032 (KILO TONS) 90
      54. TABLE 51 FRANCE TANK CLEANING CHEMICALS MARKET, BY TANK, 2018-2032 (USD MILLION) 91
      55. TABLE 52 FRANCE TANK CLEANING CHEMICALS MARKET, BY TANK, 2018-2032 (KILO TONS) 91
      56. TABLE 53 FRANCE: TANK CLEANING CHEMICALS MARKET, BY END-USER, 2018-2032 (USD MILLION) 91
      57. TABLE 54 FRANCE: TANK CLEANING CHEMICALS MARKET, BY END-USER, 2018-2032 (KILO TONS) 92
      58. TABLE 55 UK TANK CLEANING CHEMICALS MARKET, BY PRODUCT, 2018-2032 (USD MILLION) 92
      59. TABLE 56 UK TANK CLEANING CHEMICALS MARKET, BY PRODUCT, 2018-2032 (KILO TONS) 93
      60. TABLE 57 UK TANK CLEANING CHEMICALS MARKET, BY TANK, 2018-2032 (USD MILLION) 93
      61. TABLE 58 UK TANK CLEANING CHEMICALS MARKET, BY TANK, 2018-2032 (KILO TONS) 93
      62. TABLE 59 UK: TANK CLEANING CHEMICALS MARKET, BY END-USER, 2018-2032 (USD MILLION) 94
      63. TABLE 60 UK: TANK CLEANING CHEMICALS MARKET, BY END-USER, 2018-2032 (KILO TONS) 94
      64. TABLE 61 SPAIN TANK CLEANING CHEMICALS MARKET, BY PRODUCT, 2018-2032 (USD MILLION) 95
      65. TABLE 62 SPAIN TANK CLEANING CHEMICALS MARKET, BY PRODUCT, 2018-2032 (KILO TONS) 95
      66. TABLE 63 SPAIN TANK CLEANING CHEMICALS MARKET, BY TANK, 2018-2032 (USD MILLION) 95
      67. TABLE 64 SPAIN TANK CLEANING CHEMICALS MARKET, BY TANK, 2018-2032 (KILO TONS) 96
      68. TABLE 65 SPAIN: TANK CLEANING CHEMICALS MARKET, BY END-USER, 2018-2032 (USD MILLION) 96
      69. TABLE 66 SPAIN: TANK CLEANING CHEMICALS MARKET, BY END-USER, 2018-2032 (KILO TONS) 96
      70. TABLE 67 ITALY TANK CLEANING CHEMICALS MARKET, BY PRODUCT, 2018-2032 (USD MILLION) 97
      71. TABLE 68 ITALY TANK CLEANING CHEMICALS MARKET, BY PRODUCT, 2018-2032 (KILO TONS) 97
      72. TABLE 69 ITALY TANK CLEANING CHEMICALS MARKET, BY TANK, 2018-2032 (USD MILLION) 98
      73. TABLE 70 ITALY TANK CLEANING CHEMICALS MARKET, BY TANK, 2018-2032 (KILO TONS) 98
      74. TABLE 71 ITALY: TANK CLEANING CHEMICALS MARKET, BY END-USER, 2018-2032 (USD MILLION) 98
      75. TABLE 72 ITALY: TANK CLEANING CHEMICALS MARKET, BY END-USER, 2018-2032 (KILO TONS) 99
      76. TABLE 73 NORWAY TANK CLEANING CHEMICALS MARKET, BY PRODUCT, 2018-2032 (USD MILLION) 99
      77. TABLE 74 NORWAY TANK CLEANING CHEMICALS MARKET, BY PRODUCT, 2018-2032 (KILO TONS) 99
      78. TABLE 75 NORWAY TANK CLEANING CHEMICALS MARKET, BY TANK, 2018-2032 (USD MILLION) 100
      79. TABLE 76 NORWAY TANK CLEANING CHEMICALS MARKET, BY TANK, 2018-2032 (KILO TONS) 100
      80. TABLE 77 NORWAY: TANK CLEANING CHEMICALS MARKET, BY END-USER, 2018-2032 (USD MILLION) 101
      81. TABLE 78 NORWAY: TANK CLEANING CHEMICALS MARKET, BY END-USER, 2018-2032 (KILO TONS) 101
      82. TABLE 79 NETHERLAND TANK CLEANING CHEMICALS MARKET, BY PRODUCT, 2018-2032 (USD MILLION) 102
      83. TABLE 80 NETHERLAND TANK CLEANING CHEMICALS MARKET, BY PRODUCT, 2018-2032 (KILO TONS) 102
      84. TABLE 81 NETHERLAND TANK CLEANING CHEMICALS MARKET, BY TANK, 2018-2032 (USD MILLION) 102
      85. TABLE 82 NETHERLAND TANK CLEANING CHEMICALS MARKET, BY TANK, 2018-2032 (KILO TONS) 103
      86. TABLE 83 NETHERLAND: TANK CLEANING CHEMICALS MARKET, BY END-USER, 2018-2032 (USD MILLION)

    Tank Cleaning Chemicals Market Segmentation

    Market Segmentation Overview

    • Detailed segmentation data will be available in the full report
    • Comprehensive analysis by multiple parameters
    • Regional and country-level breakdowns
    • Market size forecasts by segment
    Infographic

    Free Sample Request

    Kindly complete the form below to receive a free sample of this Report

    Get Free Sample

    Customer Strories

    “I am very pleased with how market segments have been defined in a relevant way for my purposes (such as "Portable Freezers & refrigerators" and "last-mile"). In general the report is well structured. Thanks very much for your efforts.”

    Victoria Milne

    Founder
    Case Study
    Chemicals and Materials