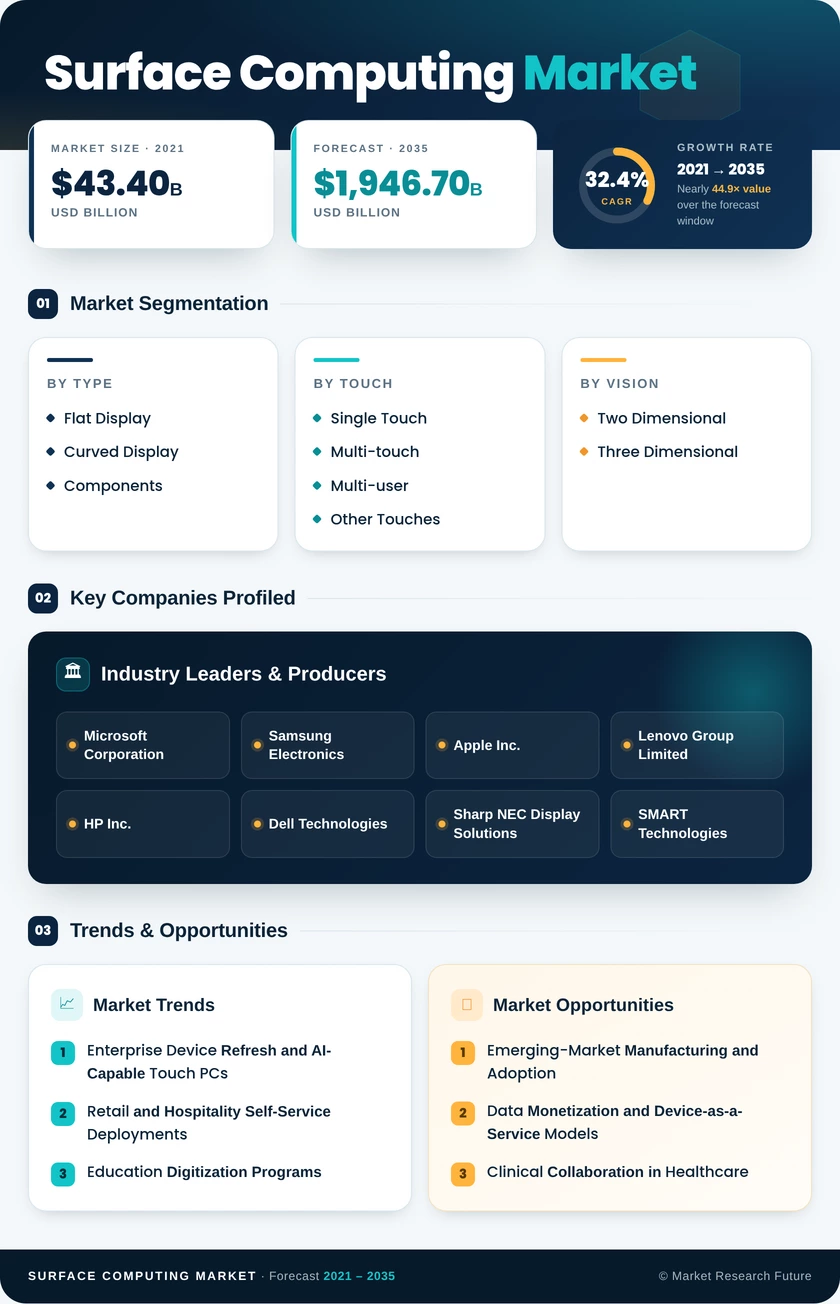
Surface Computing Market (2026 - 2035)

ID: MRFR/ICT/26330-HCR 100 Pages Nirmit Biswas Last Updated: October 16, 2026
Surface Computing Market Size, Share and Research Report By Type (Flat Display, Curved Display, Components), By Touch (Single Touch, Multi-touch, Multi-user, Other Touches), By Vision (Two Dimensional, Three Dimensional), By Application (Entertainment, Retail, Hospitality, Healthcare, Commercial, Advertisement, Automotive, Education, Other Applications) and By Regional (North America, Europe, Asia, Latin America, Middle East and Africa) - Industry Forecast to 2035.
Surface Computing Market
Market Size
Forecast Period2026-2035
CAGR (2026-2035)32.4%
2025 Market SizeUSD 117.6 billion
2035 Market SizeUSD 1,946.7 billion
Key Players
Microsoft Corporation
Samsung Electronics
Apple Inc.
Lenovo Group Limited
HP Inc.
Dell Technologies
Opportunities
  • Emerging-Market Manufacturing and Adoption
  • Data Monetization and Device-as-a-Service Models
  • Clinical Collaboration in Healthcare
  1. 1 Market Summary | |
  2. 2 Key Report Takeaways | |
    1. 2.1 By Type | |
    2. 2.2 By Touch | |
    3. 2.3 By Vision | |
    4. 2.4 By Application | |
    5. 2.5 By Region | |
  3. 3 Market Size and Forecast (2021–2035) | |
    1. 3.1 Historical Market Size (2021–2024) | |
    2. 3.2 Base Year and Forecast Market Size (2025–2035) | |
    3. 3.3 Year-over-Year Growth Analysis | |
  4. 4 Driver Impact Analysis | |
    1. 4.1 Enterprise Device Refresh and AI-Capable Touch PCs | |
    2. 4.2 Retail and Hospitality Self-Service Deployments | |
    3. 4.3 Education Digitization Programs | |
    4. 4.4 Automotive Cockpit Touch and Gesture Controls | |
    5. 4.5 Display Technology Advances and Local Manufacturing | |
    6. 4.6 Hybrid-Work Collaboration Rooms | |
  5. 5 Restraints Impact Analysis | |
    1. 5.1 High Acquisition and Installation Cost | |
    2. 5.2 Interface Design Complexity and Multi-Directional Media | |
    3. 5.3 Intense Competition and Price Erosion | |
    4. 5.4 Tariff Exposure and Component Supply Volatility | |
    5. 5.5 Cybersecurity, Privacy and Compliance Burden | |
  6. 6 Opportunities | |
    1. 6.1 Emerging-Market Manufacturing and Adoption | |
    2. 6.2 Data Monetization and Device-as-a-Service Models | |
    3. 6.3 Clinical Collaboration in Healthcare | |
    4. 6.4 Spatial and Three-Dimensional Interaction | |
    5. 6.5 Software-Defined Vehicle Interiors | |
  7. 7 Regional Market Share and Country-Level Analysis | |
    1. 7.1 North America | | |
      1. 7.1.1 United States | | |
      2. 7.1.2 Canada | |
    2. 7.2 Europe | | |
      1. 7.2.1 United Kingdom | | |
      2. 7.2.2 Germany | | |
      3. 7.2.3 France | | |
      4. 7.2.4 Rest of Europe | |
    3. 7.3 Asia | | |
      1. 7.3.1 China | | |
      2. 7.3.2 Japan | | |
      3. 7.3.3 India | | |
      4. 7.3.4 Australia and New Zealand | |
    4. 7.4 Latin America | | |
      1. 7.4.1 Mexico | | |
      2. 7.4.2 Brazil | | |
      3. 7.4.3 Argentina | | |
      4. 7.4.4 Rest of Latin America | |
    5. 7.5 Middle East and Africa | | |
      1. 7.5.1 Saudi Arabia | | |
      2. 7.5.2 United Arab Emirates | | |
      3. 7.5.3 South Africa | | |
      4. 7.5.4 Rest of Middle East and Africa | |
  8. 8 Future Outlook (2026–2035) | |
    1. 8.1 On-Device AI and Multimodal Interaction | |
    2. 8.2 Platform Economics and Device-as-a-Service | |
    3. 8.3 Flexible, Rollable and Transparent Displays | |
    4. 8.4 Circular Design and Sustainability | |
  9. 9 Segmentation Analysis | |
    1. 9.1 By Type | | |
      1. 9.1.1 Flat Display | | |
      2. 9.1.2 Curved Display | | |
      3. 9.1.3 Components | |
    2. 9.2 By Touch | | |
      1. 9.2.1 Single Touch | | |
      2. 9.2.2 Multi-touch | | |
      3. 9.2.3 Multi-user | | |
      4. 9.2.4 Other Touches | |
    3. 9.3 By Vision | | |
      1. 9.3.1 Two Dimensional | | |
      2. 9.3.2 Three Dimensional | |
    4. 9.4 By Application | | |
      1. 9.4.1 Entertainment | | |
      2. 9.4.2 Retail | | |
      3. 9.4.3 Hospitality | | |
      4. 9.4.4 Healthcare | | |
      5. 9.4.5 Commercial | | |
      6. 9.4.6 Advertisement | | |
      7. 9.4.7 Automotive | | |
      8. 9.4.8 Education | | |
      9. 9.4.9 Other Applications | |
  10. 10 Competitive Landscape | |
    1. 10.1 Market Concentration Analysis | |
    2. 10.2 Competitive Benchmarking Matrix | |
    3. 10.3 Company Profiles | | |
      1. 10.3.1 Microsoft Corporation | | |
      2. 10.3.2 Samsung Electronics | | |
      3. 10.3.3 Apple Inc. | | |
      4. 10.3.4 Lenovo Group Limited | | |
      5. 10.3.5 HP Inc. | | |
      6. 10.3.6 Dell Technologies | | |
      7. 10.3.7 Sharp NEC Display Solutions | | |
      8. 10.3.8 SMART Technologies | | |
      9. 10.3.9 Elo Touch Solutions | | |
      10. 10.3.10 Planar Systems (Leyard) | | |
      11. 10.3.11 Ideum | |
  11. 11 Recent News & Developments | |
  12. 12 Report Scope and Methodology | |
  13. 13 Detailed Sources and Citations | |
  14. 14 Frequently Asked Questions (FAQs) | | LIST OF TABLES | |
  15. TABLE 1 Report Snapshot – Study Period, Market Size and CAGR | |
  16. TABLE 2 Market Size and Forecast, by Revenue (USD billion), 2021–2035 | |
  17. TABLE 3 Driver Impact Analysis, 2026–2035 | |
  18. TABLE 4 Restraints Impact Analysis, 2026–2035 | |
  19. TABLE 5 Regional Summary, by Region, 2025 | |
  20. TABLE 6 North America Market, by Country, 2025 | |
  21. TABLE 7 Europe Market, by Country, 2025 | |
  22. TABLE 8 Asia Market, by Country, 2025 | |
  23. TABLE 9 Latin America Market, by Country, 2025 | |
  24. TABLE 10 Middle East and Africa Market, by Country, 2025 | |
  25. TABLE 11 Market Segmentation, by Type, 2025 | |
  26. TABLE 12 Market Segmentation, by Touch, 2025 | |
  27. TABLE 13 Market Segmentation, by Vision, 2025 | |
  28. TABLE 14 Market Segmentation, by Application, 2025 | |
  29. TABLE 15 Competitive Benchmarking Matrix, 2025 | |
  30. TABLE 16 Report Scope and Methodology | |
  31. TABLE 17 Detailed Sources and Citations | |
  32. TABLE 18 Segmentation Quick Reference | | LIST OF FIGURES | |
  33. FIGURE 1 Market Dynamics Overview – Drivers, Restraints and Opportunities | |
  34. FIGURE 2 Industry Value Chain Analysis | |
  35. FIGURE 3 Porter's Five Forces Analysis | |
  36. FIGURE 4 Market Size Trend, 2021–2035 (USD billion) | |
  37. FIGURE 5 Year-over-Year Growth Trend, 2021–2035 | |
  38. FIGURE 6 Segment Share, by Type, 2025 | |
  39. FIGURE 7 Segment Share, by Touch, 2025 | |
  40. FIGURE 8 Segment Share, by Vision, 2025 | |
  41. FIGURE 9 Segment Share, by Application, 2025 | |
  42. FIGURE 10 Regional Share, by Region, 2025 | |
  43. FIGURE 11 Country Share within Each Region, 2025 | |
  44. FIGURE 12 Competitive Landscape – Estimated Revenue Share Ranges, 2025 | |
  45. FIGURE 13 Competitive Positioning Matrix

Segmentation Quick Reference

DimensionSub-SegmentsDominant SegmentFastest Growing Segment
By TypeFlat Display, Curved Display, ComponentsFlat Display (48.6% share)Curved Display (38.9% CAGR)
By TouchSingle Touch, Multi-touch, Multi-user, Other TouchesMulti-touch (50.8% share)Multi-user (37.6% CAGR)
By VisionTwo Dimensional, Three DimensionalTwo Dimensional (71.5% share)Three Dimensional (40.2% CAGR)
By ApplicationEntertainment, Retail, Hospitality, Healthcare, Commercial, Advertisement, Automotive, Education, Other ApplicationsRetail (21.7% share)Automotive (41.5% CAGR)
By RegionNorth America, Europe, Asia, Latin America, Middle East and AfricaNorth America (37.2% share)Asia (36.1% CAGR)

Market Segmentation Overview

By Type

Sub-SegmentKey Trend
Flat DisplayPrice-per-inch declines keep flat panels the default for offices, schools and retail.
Curved DisplayWraparound screens spread from vehicle cockpits into control rooms and flagship stores.
ComponentsScreen, Camera, Sensor, Processor, Software, Projector and Other Components shift toward AI-ready sensors and software.

Flat Display leads by type because flat glass suits nearly every installation and benefits from the deepest panel supply base. Curved Display grows fastest as automakers and immersive-retail designers specify wraparound screens that flat panels cannot replicate. Within Components, sensors and software gain ground as on-device recognition replaces projector-and-camera tracking.

By Touch

Sub-SegmentKey Trend
Single TouchPersists in ticketing, industrial controls and low-cost kiosks
Multi-touchStandard input on tablets, 2-in-1 PCs and wall boards
Multi-userShared tabletops and meeting-room surfaces scale quickly
Other TouchesPressure, haptic and hover sensing serve specialist niches

Multi-touch dominates touch because it is built into almost every tablet, convertible PC and collaboration board shipped today. Multi-user grows fastest since museums, hotels and hybrid-work rooms need several people interacting at once without input conflicts. Single Touch retains a role where ruggedness and simplicity outweigh gesture support.

By Vision

Sub-SegmentKey Trend
Two DimensionalMainstream touch and camera tracking across retail, office and education
Three DimensionalDepth sensing enables hand-pose, object and above-surface interaction.

Two-dimensional vision leads because standard touch tracking meets the needs of most retail counters, classrooms and offices at low cost. Three-dimensional systems grow fastest as depth cameras and neural processors make above-surface gesture recognition reliable enough for medical imaging, design review and vehicle controls.

By Application

Sub-SegmentKey Trend
EntertainmentGaming tables, venues and theme-park attractions
RetailEndless-aisle tables, self-service and product discovery
HospitalitySelf-check-in, ordering and concierge surfaces
HealthcareTumor boards, theater scheduling and patient education
CommercialMeeting rooms, lobbies and corporate briefing centers
AdvertisementInteractive signage linked to retail media networks
AutomotiveCockpit displays consolidating physical controls.
EducationNational classroom digitization and board refreshes
Other ApplicationsDefense, energy control rooms and public services

Retail leads applications because chains deploy tables and walls for product discovery, self-checkout and loyalty enrollment at scale. Automotive grows fastest as software-defined vehicles route climate, media and driver-assistance controls through wide touch displays. Healthcare and Hospitality follow closely, driven by staff shortages and demand for self-service workflows.


Download PDF ×

We do not share your information with anyone. However, we may send you emails based on your report interest from time to time. You may contact us at any time to opt-out.