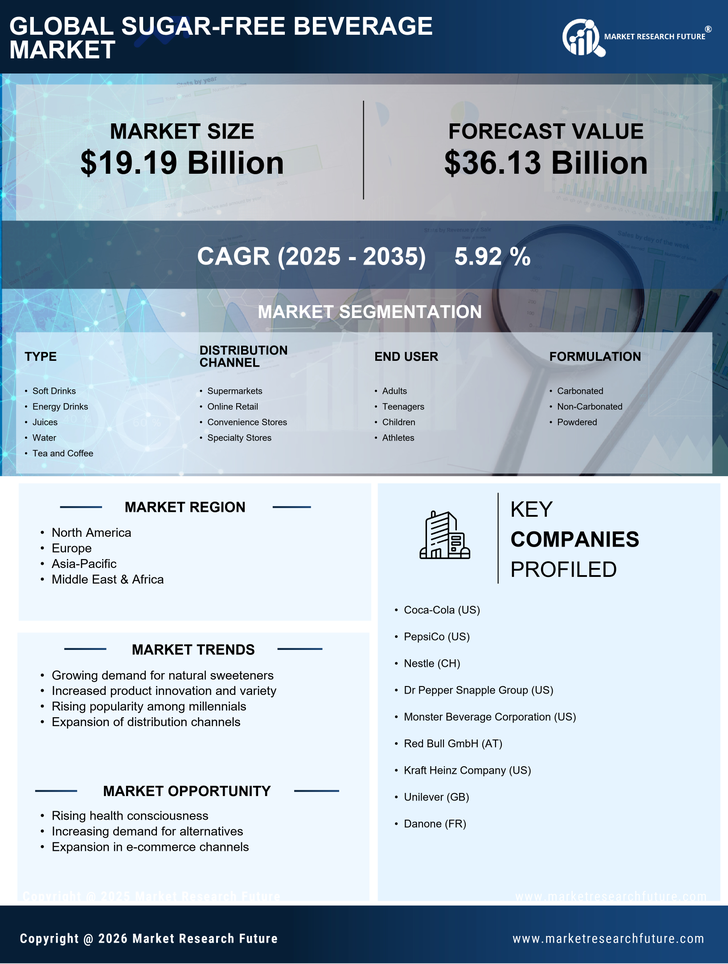
Certified Global Research Member
Isomar fd.webp Wcrc 57.webp
Key Questions Answered
  • Global Market Outlook
  • In-depth analysis of global and regional trends
  • Analyze and identify the major players in the market, their market share, key developments, etc.
  • To understand the capability of the major players based on products offered, financials, and strategies.
  • Identify disrupting products, companies, and trends.
  • To identify opportunities in the market.
  • Analyze the key challenges in the market.
  • Analyze the regional penetration of players, products, and services in the market.
  • Comparison of major playersโ€™ financial performance.
  • Evaluate strategies adopted by major players.
  • Recommendations
Why Choose Market Research Future?
  • Vigorous research methodologies for specific market.
  • Knowledge partners across the globe
  • Large network of partner consultants.
  • Ever-increasing/ Escalating data base with quarterly monitoring of various markets
  • Trusted by fortune 500 companies/startups/ universities/organizations
  • Large database of 5000+ markets reports.
  • Effective and prompt pre- and post-sales support.

Sugar-Free Beverages Market Research Report Information by Product Type (Fruits & Vegetables Juices, Soft Drinks, Energy Drinks, Dairy Beverages, and Others), Claim (Gluten-Free, Lactose-Free, Organic, and Others), Distribution Channel (Store Based, Non-Store Based) and Region Forecast Till 2030


ID: MRFR/F-B & N/2582-HCR | 110 Pages | Author: Pradeep Nandi| April 2024
Leading companies partner with us for data-driven Insights
client_1 client_2 client_3 client_4 client_5 client_6 client_7 client_8 client_9 client_10
Please fill in Business Email for Quick Response

Table of Content

Chapter 1. Methodology and Scope

1.1. Research Methodology

1.1.1 Initial Data Exploration

1.1.2 Statistical Modelling & Forecast

1.1.3 Industry Insights and Validation

1.2. Data Sources

Chapter 2. Executive Summary

2.1. Sugar-Free BEVERAGES Market Synopsis, 2022โ€“2030

2.1.1 Business Trends

2.1.2 Product Type Trends

2.1.3 Claim Trends

Chapter 3 Sugar-Free BEVERAGES Market Insights

3.1 Industry Segmentation

3.2 Industry Size & Forecast

3.3 Industry Ecosystem Analysis

3.4 Industry Impact Forces

3.4.1 Growth Drivers

3.4.1.1 Increase in Disposable Income

3.4.1.2 Growing Consciousness Towards Health & Wellness

3.4.1.3 Rising Incidences of Diabetes & Obesity

3.4.2 Industry Pitfalls & Challenges

3.4.2.1 Highly Competitive Market

3.4.2.1 Growing Criticism Over Health Claims of The Product

3.5 Growth Potential Analysis

3.6 Company Market Share Analysis, 2030

3.7 Porterโ€™s Analysis

3.8 PESTEL Analysis

Chapter 4 Sugar-Free BEVERAGES Market, by Product Type

4.1 Global Sugar-Free BEVERAGES Market Value Share, by Product Type, 2022โ€“2030

4.1.1 Fruits & Vegetables Juices

4.1.1.1 Market Estimates & Forecast, 2022โ€“2030

4.1.2 Soft Drinks

4.1.2.1 Market Estimates & Forecast, 2022โ€“2030

4.1.3 Energy Drinks

4.1.3.1 Market Estimates & Forecast, 2022โ€“2030

4.1.4 Dairy Beverages

4.1.4.1 Market Estimates & Forecast, 2022โ€“2030

4.1.5 Others

4.1.5.1 Market Estimates & Forecast, 2022โ€“2030

Chapter 5 Sugar-Free BEVERAGES Market by Claims

5.1 Global Sugar-Free BEVERAGES Market Value Share, by Claim, 2022โ€“2030

5.1.1 Gluten-Free

5.1.1.1 Market Estimates & Forecast, 2022โ€“2030

5.1.2 Lactose-Free

5.1.2.1 Market Estimates & Forecast, 2022โ€“2030

5.1.3 Organic

5.1.3.1 Market Estimates & Forecast, 2022โ€“2030

5.1.4 Others

5.1.4.1 Market Estimates & Forecast, 2022โ€“2030

Chapter 6 Sugar-Free BEVERAGES Market, by Distribution Channel

6.1 Global Sugar-Free BEVERAGES Market Value Share, by Distribution Channel, 2022 & 2030

6.1.1 Store-Based

6.1.1.1 Market Estimates & Forecast, 2022โ€“ 2030

6.1.1.2 Market Estimates & Forecast, by Region, 2022โ€“2030

6.1.2 Non-Store Based

6.1.2.1 Market Estimates & Forecast, 2022โ€“2030

6.1.2.2 Market Estimates & Forecast by Region, 2022โ€“2030

Chapter 7 Sugar-Free BEVERAGES Market Regional Insights

7.1 Sugar-Free BEVERAGES Market Value Share, by Region, 2022 & 2030

7.2 North America

7.2. A Market Estimates & Forecast, 2022โ€“2030

7.2. B Market Estimates & Forecast, by Product Type, 2022โ€“2030

7.2. C Market Estimates & Forecast, by Claim, 2022โ€“2030

7.2. D Market Estimates & Forecast, by Distribution Channel, 2022โ€“2030

7.2.1 U.S.

7.2.1.1 Market Estimates & Forecast, 2022โ€“2030

7.2.1.2 Market Estimates & Forecast, by Product Type, 2022โ€“2030

7.2.1.3 Market Estimates & Forecast, by Claim, 2022โ€“2030

7.2.1.4 Market Estimates & Forecast, by Distribution Channel, 2022โ€“2030

7.2.2 Canada

7.2.2.1 Market Estimates & Forecast, 2022โ€“2030

7.2.2.2 Market Estimates & Forecast, by Product Type, 2022โ€“2030

7.2.2.3 Market Estimates & Forecast, by Claim, 2022โ€“2030

7.2.2.4 Market Estimates & Forecast, by Distribution Channel, 2022โ€“2030

7.2.3 Mexico

7.2.3.1 Market Estimates & Forecast, 2022โ€“2030

7.2.3.2 Market Estimates & Forecast, by Product Type, 2022โ€“2030

7.2.3.3 Market Estimates & Forecast, by Claim, 2022โ€“2030

7.2.3.4 Market Estimates & Forecast, by Distribution Channel, 2022โ€“2030

7.3 Europe

7.3.1.1 Market Estimates & Forecast, 2022โ€“2030

7.3.1.2 Market Estimates & Forecast, by Product Type, 2022โ€“2030

7.3.1.3 Market Estimates & Forecast, by Claim, 2022โ€“2030

7.3.1.4 Market Estimates & Forecast, by Distribution Channel, 2022โ€“2030

7.3.1 Germany

7.3.1.1 Market Estimates & Forecast, 2022โ€“2030

7.3.1.2 Market Estimates & Forecast, by Product Type, 2022โ€“2030

7.3.1.3 Market Estimates & Forecast, by Claim, 2022โ€“2030

7.3.1.4 Market Estimates & Forecast, by Distribution Channel, 2022โ€“2030

7.3.2 U.K.

7.3.2.1 Market Estimates & Forecast, 2022โ€“2030

7.3.2.2 Market Estimates & Forecast, by Product Type, 2022โ€“2030

7.3.2.3 Market Estimates & Forecast, by Claim, 2022โ€“2030

7.3.2.4 Market Estimates & Forecast, by Distribution Channel, 2022โ€“2030

7.3.3 France

7.3.3.1 Market Estimates & Forecast, 2022โ€“2030

7.3.3.2 Market Estimates & Forecast, by Product Type, 2022โ€“2030

7.3.3.3 Market Estimates & Forecast, by Claim, 2022โ€“2030

7.3.3.4 Market Estimates & Forecast, by Distribution Channel, 2022โ€“2030

7.3.4 Italy

7.3.4.1 Market Estimates & Forecast, 2022โ€“2030

7.3.4.2 Market Estimates & Forecast, by Product Type, 2022โ€“2030

7.3.4.3 Market Estimates & Forecast, by Claim, 2022โ€“2030

7.3.4.4 Market Estimates & Forecast, by Distribution Channel, 2022โ€“2030

7.4 Asia Pacific

7.4. A Market Estimates & Forecast, 2022โ€“2030

7.4. B Market Estimates & Forecast, by Product Type, 2022โ€“2030

7.4. C Market Estimates & Forecast, by Claim, 2022โ€“2030

7.4. D Market Estimates & Forecast, by Distribution Channel, 2022โ€“2030

7.4.1 China

7.4.1.1 Market Estimates & Forecast, 2022โ€“2030

7.4.1.2 Market Estimates & Forecast, by Product Type, 2022โ€“2030

7.4.1.3 Market Estimates & Forecast, by Claim, 2022โ€“2030

7.4.1.4 Market Estimates & Forecast, by Distribution Channel, 2022โ€“2030

7.4.2 India

7.4.2.1 Market Estimates & Forecast, 2022โ€“2030

7.4.2.2 Market Estimates & Forecast, by Product Type, 2022โ€“2030

7.4.2.3 Market Estimates & Forecast, by Claim, 2022โ€“2030

7.4.2.4 Market Estimates & Forecast, by Distribution Channel, 2022โ€“2030

7.4.3 Japan

7.4.3.1 Market Estimates & Forecast, 2022โ€“2030

7.4.3.2 Market Estimates & Forecast, by Product Type, 2022โ€“2030

7.4.3.3 Market Estimates & Forecast, by Claim, 2022โ€“2030

7.4.3.4 Market Estimates & Forecast, by Distribution Channel, 2022โ€“2030

7.5 RoW

7.5. A Market Estimates & Forecast, 2022โ€“2030

7.5. B Market Estimates & Forecast, by Product Type, 2022โ€“2030

7.5. C Market Estimates & Forecast, by Claim, 2022โ€“2030

7.5. D Market Estimates & Forecast, by Distribution Channel, 2022โ€“2030

Chapter 8 Competitor Profile

8.1 The Hershey Company (U.S.)

8.1.1 Business Overview

8.1.2 Financial Data

8.1.3 Product Landscape

8.1.4 Key Developments

8.1.5 Business Strategy

8.1.6 SWOT Analysis

8.2 Bai Brand LLC (U.S.)

8.2.1 Business Overview

8.2.2 Financial Data

8.2.3 Product Landscape

8.2.4 Key Developments

8.2.5 Business Strategy

8.2.6 SWOT Analysis

8.3 Nestlรฉ (Europe)

8.3.1 Business Overview

8.3.2 Financial Data

8.3.3 Product Landscape

8.3.4 Key Developments

8.3.5 Business Strategy

8.3.6 SWOT Analysis

8.4 Unilever (U.K.)

8.4.1 Business Overview

8.4.2 Financial Data

8.4.3 Product Landscape

8.4.4 Key Developments

8.4.5 Business Strategy

8.4.6 SWOT Analysis

8.5 The Coca-Cola Company (U.S.)

8.5.1 Business Overview

8.5.2 Financial Data

8.5.3 Product Landscape

8.5.4 Key Developments

8.5.5 Business Strategy

8.5.6 SWOT Analysis

8.6 PepsiCo (U.S.)

8.6.1 Business Overview

8.6.2 Financial Data

8.6.3 Product Landscape

8.6.4 Key Developments

8.6.5 Business Strategy

8.6.6 SWOT Analysis

8.7 Dabur (India)

8.7.1 Business Overview

8.7.2 Financial Data

8.7.3 Product Landscape

8.7.4 Key Developments

8.7.5 Business Strategy

8.7.6 SWOT Analysis

8.8 The Kraft Heinz Company (U.S.)

8.8.1 Business Overview

8.8.2 Financial Data

8.8.3 Product Landscape

8.8.4 Key Developments

8.8.5 Business Strategy

8.8.6 SWOT Analysis

Data Tables

TABLE 1 PESTLE ANALYSIS โ€“ U.S.

TABLE 2 PESTLE ANALYSIS- CANADA

TABLE 3 PESTLE ANALYSIS- CHINA

TABLE 4 PESTLE ANALYSIS- FRANCE

TABLE 5 PESTLE ANALYSIS- U.K.

TABLE 6 KEY SUPPLIERS OF SUGAR-FREE BEVERAGES

TABLE 7 GLOBAL MARKET FOR SUGAR-FREE BEVERAGES, BY PRODUCT TYPE, (2022โ€“2030), USD MILLION

TABLE 8 GLOBAL MARKET FOR SUGAR-FREE BEVERAGES, BY CLAIM, (2022โ€“2030), USD MILLION

TABLE 9 GLOBAL MARKET FOR SUGAR-FREE BEVERAGES, BY DISTRIBUTION CHANNEL, (2022โ€“2030), USD MILLION

TABLE 10 GLOBAL SUGAR-FREE BEVERAGES SALES & GROWTH RATE, (2022โ€“2030) USD MILLION

TABLE 11 GLOBAL MARKET FOR SUGAR-FREE BEVERAGES TOP FIVE COUNTRIES

TABLE 12 GLOBAL MARKET FOR SUGAR-FREE BEVERAGES TOP COMPANIES, USD MILLION

TABLE 13 NORTH AMERICAN MARKET FOR SUGAR-FREE BEVERAGES, BY PRODUCT TYPE, (2022โ€“2030) USD MILLION

TABLE 14 NORTH AMERICAN MARKET FOR SUGAR-FREE BEVERAGES, BY CLAIM, (2022โ€“2030), USD MILLION

TABLE 15 NORTH AMERICAN MARKET FOR SUGAR-FREE BEVERAGES, BY DISTRIBUTION CHANNEL, (2022โ€“2030), USD MILLION

TABLE 16 EUROPEAN MARKET FOR SUGAR-FREE BEVERAGES, BY PRODUCT TYPE, (2022โ€“2030), USD MILLION

TABLE 17 EUROPEAN MARKET FOR SUGAR-FREE BEVERAGES, BY CLAIM, (2022โ€“2030), USD MILLION

TABLE 18 EUROPEAN MARKET FOR SUGAR-FREE BEVERAGES, BY DISTRIBUTION CHANNEL, (2022โ€“2030), USD MILLION

TABLE 19 APAC MARKET FOR SUGAR-FREE BEVERAGES, BY PRODUCT TYPE, (2022โ€“2030), USD MILLION

TABLE 20 APAC MARKET FOR SUGAR-FREE BEVERAGES, BY CLAIM, (2022โ€“2030) USD MILLION

TABLE 21 APAC MARKET FOR SUGAR-FREE BEVERAGES, BY DISTRIBUTION CHANNEL, (2022โ€“2030), USD MILLION

TABLE 22 REST OF THE WORLD MARKET FOR SUGAR-FREE BEVERAGES, BY PRODUCT TYPE, (2022โ€“2030), USD MILLION

TABLE 23 REST OF THE WORLD MARKET FOR SUGAR-FREE BEVERAGES, BY CLAIM, (2022โ€“2030), USD MILLION

TABLE 24 REST OF THE WORLD MARKET FOR SUGAR-FREE BEVERAGES, BY DISTRIBUTION CHANNEL, (2022โ€“2030), USD MILLION

TABLE 25 COMPETITIVE LANDSCAPING BASED ON FINANCIALS DURING THE YEAR 2030โ€ƒ

Charts & Figures

LIST OF FIGURES

FIGURE 1 RESEARCH METHODOLOGY

FIGURE 2 PRIMARY DATA ANALYSIS APPROACH

FIGURE 3 SECONDARY DATA ANALYSIS APPROACH

FIGURE 4 TRENDS IN SUGAR-FREE BEVERAGES IMPORTS, 2022โ€“2030

FIGURE 5 GROWTH RATE IN SUGAR-FREE BEVERAGES IMPORTS, 2022โ€“2030

FIGURE 6 SUGAR-FREE BEVERAGES IMPORTS MARKET SHARE, BY TOP FIVE IMPORTERS (2022 VS. 2030)

FIGURE 7 TRENDS IN SUGAR-FREE BEVERAGESSEXPORTS, 2022โ€“2030

FIGURE 8 GROWTH RATE SUGAR-FREE BEVERAGESSEXPORTS, 2022โ€“2030

FIGURE 9 SUGAR-FREE BEVERAGESSEXPORTS MARKET SHARE BY TOP FIVE EXPORTERS (2022 VS. 2030)

FIGURE 10 VALUE CHAIN ANALYSIS

FIGURE 11 COST ANALYSIS: SUGAR-FREE BEVERAGES

FIGURE 12 PORTERโ€™S FIVE FORCES ANALYSIS

FIGURE 13 GLOBAL MARKET FOR SUGAR-FREE BEVERAGES TRENDS, BY PRODUCT TYPE

FIGURE 14 GLOBAL MARKET FOR SUGAR-FREE BEVERAGES TRENDS, BY CLAIM

FIGURE 15 GLOBAL MARKET FOR SUGAR-FREE BEVERAGES TRENDS, BY DISTRIBUTION CHANNEL

FIGURE 1 FINANCIALS

Purchase Option
Single User $ 4,950
Multiuser License $ 5,950
Enterprise User $ 7,250
Compare Licenses
Tailored for You
  • Dedicated Research on any specifics segment or region.
  • Focused Research on specific players in the market.
  • Custom Report based only on your requirements.
  • Flexibility to add or subtract any chapter in the study.
  • Historic data from 2014 and forecasts outlook till 2040.
  • Flexibility of providing data/insights in formats (PDF, PPT, Excel).
  • Provide cross segmentation in applicable scenario/markets.