×
  • Cat-intel
  • MedIntelliX
  • Resources
  • About Us
  • Hero Background
    English
    Chinese
    French
    Japanese
    Korean
    German
    Spanish

    Struts Construction Market Size

    ID: MRFR/CO/11117-HCR
    128 Pages
    Snehal Singh
    October 2025

    Struts Construction Market Research Report Information By Material (Aluminum, Stainless Steel, and Fiberglass), By End User (Oil & Gas, Aerospace & Defense, Automotive, and Others), By Sales Channel (OEM, Retail, and E-Commerce), and By Region (North America, Europe, Asia-Pacific, And Rest Of The World) –Market Forecast Till 2035

    Share:
    Download PDF ×

    We do not share your information with anyone. However, we may send you emails based on your report interest from time to time. You may contact us at any time to opt-out.

    Struts Construction Market Infographic
    Purchase Options

    Struts Construction Size

    Struts Construction Market Growth Projections and Opportunities

    Struts construction market dynamics are shaped by many things. Economy is a major market component. Economic stability and growth boost construction, increasing strut demand. In a recession, construction projects may be postponed or cut back, affecting the struts market.

    Government laws and regulations shape the struts building market. Building codes, safety requirements, and environmental regulations affect building project design and specifications, affecting strut type and amount. These requirements might benefit or hurt struts manufacturers and suppliers.

    Construction technology is another important market component. Changing materials, design, and production methods can affect strut demand. Companies that adopt new technologies may have a market advantage. Conversely, personnel that cannot adapt may struggle to meet building project needs.

    The struts construction market is affected by raw material availability and cost. Price fluctuations in steel, aluminum, and other strut manufacturing materials can affect production costs and product pricing. Geopolitical considerations, trade restrictions, and supply chain disruptions can affect global raw material sourcing, which can affect the struts market.

    Strut demand depends on regional infrastructure development. Growing urbanization and infrastructure developments like highways, bridges, and commercial buildings require struts for structural support. Strut demand may rise in metropolitan areas with rapid urban growth and fall in locations with sluggish or deteriorating infrastructure.

    Environmental and sustainability issues are growing in the building business. Climate change and environmental consciousness are driving demand for eco-friendly and energy-efficient construction materials. Sustainable and green strut producers may have an advantage in the market.

    Competition in the market also matters. Supplier numbers, market share, and competition in the truss construction market affect pricing, innovation, and industry dynamics. Research and development, customer service, and strategic collaborations may help companies compete.

    Finally, global and macroeconomic developments can greatly effect the structural construction business. Natural disasters, economic crises, and geopolitical conflicts can disrupt construction projects, hurting strut demand. Population expansion, demographic fluctuations, and consumer tastes can also affect construction projects and the struts market.
    Struts Construction Market Size Graph
    Author
    Snehal Singh
    Assistant Manager - Research

    High acumen in analyzing complex macro & micro markets with more than 6 years of work experience in the field of market research. By implementing her analytical skills in forecasting and estimation into market research reports, she has expertise in Packaging, Construction, and Equipment domains. She handles a team size of 20-25 resources and ensures smooth running of the projects, associated marketing activities, and client servicing.

    Leave a Comment

    FAQs

    How much is the Struts Construction market?

    The Struts Construction market size was valued at USD 21.63 Billion in 2024.

    What is the growth rate of the Struts Construction market?

    Struts Construction Market is projected to grow at a CAGR of 5.12% during the forecast period, 2025-2035

    Which region held the largest market share in the Struts Construction market?

    North America had the largest share of the market

    Who are the key players in the Struts Construction market?

    The key players in the market are Aetna Plastics Corp., Gregory Industries Inc., Hilti Corporation ERICO Products Inc., Eaton Corporation Inc., Cooper Industries, Carpenter & Paterson, Inc., Unistrut Corporation, Atlas Supply Co., Guenther Supply, Inc., Enduro Pipeline Services Inc.

    Which material led the Struts Construction market?

    The aluminum category dominated the market in 2024.

    Which sales channel had the largest market share in the Struts Construction market?

    The OEM had the largest share in the market.

    Market Summary

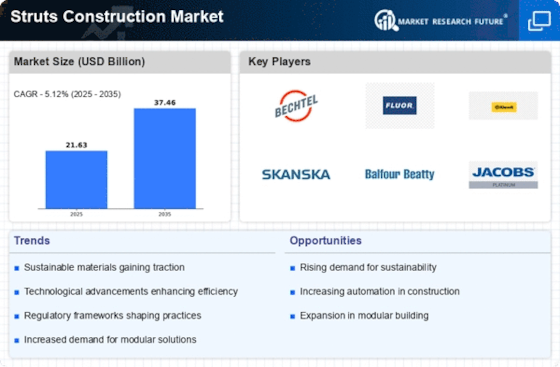
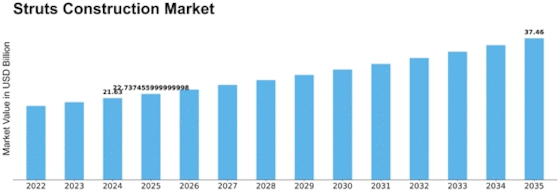
    As per MRFR analysis, the Struts Construction Market Size was estimated at 21.63 USD Billion in 2024. The Struts Construction industry is projected to grow from 22.74 USD Billion in 2025 to 37.46 USD Billion by 2035, exhibiting a compound annual growth rate (CAGR) of 5.12 during the forecast period 2025 - 2035.

    Key Market Trends & Highlights

    The Struts Construction Market is poised for growth driven by sustainability and technological advancements.

    • The market is increasingly focusing on sustainability, with eco-friendly practices gaining traction.
    • Technological advancements are reshaping construction methodologies, enhancing efficiency and safety.
    • Modular construction techniques are becoming more prevalent, particularly in North America.
    • Rising demand for infrastructure development and emphasis on safety standards are key drivers of market growth.

    Market Size & Forecast

    2024 Market Size 21.63 (USD Billion)
    2035 Market Size 37.46 (USD Billion)
    CAGR (2025 - 2035) 5.12%
    Largest Regional Market Share in 2024 North America

    Major Players

    <p>Bechtel Corporation (US), Fluor Corporation (US), Kiewit Corporation (US), Skanska AB (SE), Balfour Beatty plc (GB), Jacobs Engineering Group (US), Tetra Tech, Inc. (US), McCarthy Building Companies, Inc. (US)</p>

    Market Trends

    The Struts Construction Market is currently experiencing a dynamic evolution, driven by various factors that influence its growth trajectory. The increasing demand for efficient and sustainable construction practices appears to be a primary catalyst, as stakeholders seek to optimize resources while minimizing environmental impact. Furthermore, advancements in technology, particularly in materials and design methodologies, seem to enhance the performance and durability of struts, thereby attracting a broader range of applications across diverse sectors. This market is characterized by a growing emphasis on safety and compliance, which may lead to the adoption of innovative solutions that meet stringent regulatory standards. In addition, the Struts Construction Market is witnessing a shift towards modular and prefabricated construction techniques. This trend indicates a potential for reduced construction time and improved quality control, as components are manufactured in controlled environments before being assembled on-site. As urbanization continues to rise, the need for efficient infrastructure solutions becomes increasingly pressing. Consequently, the Struts Construction Market is poised for continued growth, with stakeholders likely to explore new opportunities that align with evolving industry demands and consumer preferences.

    Sustainability Focus

    The Struts Construction Market is increasingly prioritizing sustainable practices. Stakeholders are exploring eco-friendly materials and methods to reduce environmental footprints. This trend reflects a broader commitment to sustainability within the construction sector.

    Technological Advancements

    Innovations in technology are reshaping the Struts Construction Market. Enhanced materials and design techniques are improving the performance and longevity of struts. This evolution is likely to attract new applications and increase market competitiveness.

    Modular Construction Techniques

    The adoption of modular construction methods is gaining traction within the Struts Construction Market. This approach allows for faster assembly and improved quality control, addressing the growing demand for efficient infrastructure solutions.

    Struts Construction Market Market Drivers

    Emphasis on Safety Standards

    In the Struts Construction Market, there is an increasing emphasis on safety standards and regulations. As construction projects become more complex, the need for reliable structural support systems has never been more critical. Struts are integral in ensuring the safety and stability of various structures, which is why adherence to safety regulations is paramount. Recent statistics suggest that construction-related accidents have prompted stricter enforcement of safety protocols, thereby driving demand for high-quality struts. Companies are now investing in advanced materials and technologies to meet these safety requirements, which in turn enhances the overall market for struts. This focus on safety not only protects workers but also boosts consumer confidence in construction projects, further stimulating the struts construction market.

    Growth in Residential Construction

    The Struts Construction Market is witnessing significant growth in residential construction, driven by rising population and urban migration. As more individuals seek housing, the demand for residential buildings is escalating, leading to increased utilization of struts in construction. Recent data indicates that the residential construction sector is expected to grow at a compound annual growth rate of over 5% in the coming years. This growth is largely attributed to the need for efficient and cost-effective building solutions, where struts play a vital role in providing structural integrity. Additionally, the trend towards sustainable building practices is encouraging the use of innovative strut designs that enhance energy efficiency. As a result, the struts construction market is likely to benefit from this burgeoning residential sector.

    Sustainability and Eco-Friendly Practices

    Sustainability is becoming a pivotal driver in the Struts Construction Market, as stakeholders increasingly prioritize eco-friendly practices. The construction sector is under pressure to reduce its carbon footprint, leading to a shift towards sustainable materials and methods. Struts made from recycled or renewable resources are gaining popularity, aligning with the global push for greener construction solutions. Recent studies indicate that the market for sustainable construction materials is projected to grow significantly, which bodes well for the struts sector. Additionally, the implementation of energy-efficient designs is encouraging the use of struts that contribute to overall building performance. This focus on sustainability not only meets regulatory requirements but also appeals to environmentally conscious consumers, thereby enhancing the prospects of the struts construction market.

    Technological Innovations in Construction

    Technological innovations are reshaping the Struts Construction Market, introducing advanced materials and construction techniques. The integration of technology in construction processes has led to the development of high-performance struts that offer enhanced durability and efficiency. For example, the use of computer-aided design (CAD) and building information modeling (BIM) allows for precise planning and execution of construction projects, which optimizes the use of struts. Furthermore, the adoption of prefabrication techniques is gaining traction, enabling quicker assembly and reduced labor costs. These innovations not only improve the quality of construction but also contribute to the overall growth of the struts market. As technology continues to evolve, it is expected that the struts construction market will adapt and thrive in this dynamic environment.

    Rising Demand for Infrastructure Development

    The Struts Construction Market is experiencing a notable surge in demand due to increasing investments in infrastructure development. Governments and private entities are allocating substantial budgets for the construction of roads, bridges, and commercial buildings. For instance, recent data indicates that infrastructure spending is projected to reach trillions of dollars over the next decade, which directly benefits the struts construction sector. This trend is likely to continue as urbanization accelerates, necessitating robust structural solutions. The need for durable and efficient construction methods further propels the struts market, as these materials provide essential support in various applications. Consequently, the struts construction market is positioned to thrive amid this growing demand for infrastructure.

    Market Segment Insights

    Struts Construction Material Insights

    The Struts Construction market segmentation, based on material, includes Aluminum, Stainless Steel, and Fiberglass. The aluminum segment dominated the market, accounting for the largest market revenue due to its exceptional combination of strength and lightness, making it an ideal material for constructing sturdy yet easily transportable struts and scaffolding systems. This lightweight nature allows for easy handling and assembly on construction sites, increasing efficiency and reducing labor costs. Moreover, aluminum's resistance to corrosion and durability ensures that these struts have a longer service life, making them a cost-effective choice for construction projects.

    Further, stainless steel is the material that is the second most dominant in the market of strut construction, following aluminum. Stainless steel struts are valued for their corrosion resistance and durability, making them suitable for various construction and structural applications.

    Struts Construction End User Insights

    The Struts Construction market segmentation, based on end users, includes Oil and gas, Aerospace and defense, Automotive, and Others. The aerospace & defense category dominates the market due to the stringent demands for precision, strength, and reliability in these industries. Aircraft and defense equipment require lightweight yet robust structures, and struts play a vital role in supporting critical components and ensuring structural integrity. Moreover, the unique challenges of aerospace and defense applications, such as high-performance materials and advanced engineering, make the use of struts and support systems a common and indispensable feature in these sectors.

    Struts Construction Sales Channel Insights

    The Struts Construction market segmentation, based on sales channels, includes OEM, Retail, and E-Commerce. The OEM category dominates the market because OEMs play a fundamental role in supplying essential construction components to various industries. They require struts in bulk for manufacturing equipment, vehicles, and structures, and their consistent demand creates a substantial market. OEMs maintain long-term partnerships with strut manufacturers to ensure a steady supply of high-quality struts for their products, resulting in a dominant presence in the market as they prioritize cost-efficiency, reliability, and precision in their construction and manufacturing processes.

    Figure 1: Struts Construction Market, by Sales Channel, 2022 & 2032 (USD Billion)Source: Secondary Research, Primary Research, Market Research Future Database and Analyst Review

    Get more detailed insights about Struts Construction Market Research Report - Global Forecast by 2035

    Regional Insights

    North America : Construction Innovation Leader

    North America is the largest market for struts construction, holding approximately 45% of the global market share. The region's growth is driven by increasing infrastructure investments, urbanization, and a focus on sustainable construction practices. Regulatory support, such as the Infrastructure Investment and Jobs Act, further catalyzes demand for advanced construction solutions. The United States leads the North American market, with significant contributions from Canada. Key players like Bechtel Corporation and Fluor Corporation dominate the landscape, leveraging advanced technologies and project management expertise. The competitive environment is characterized by a mix of large firms and specialized contractors, ensuring a diverse range of offerings to meet market demands.

    Europe : Sustainable Construction Focus

    Europe is witnessing a growing demand for struts construction, accounting for about 30% of the global market share. The region's focus on sustainability and energy efficiency drives innovations in construction methods and materials. Regulatory frameworks, such as the European Green Deal, promote eco-friendly practices, enhancing market growth. Leading countries include Germany, France, and the UK, where major players like Skanska AB and Balfour Beatty plc are actively involved. The competitive landscape is marked by collaborations between construction firms and technology providers, fostering advancements in struts construction. The emphasis on sustainable practices positions Europe as a key player in the global market.

    Asia-Pacific : Rapid Urbanization Catalyst

    Asia-Pacific is emerging as a significant player in the struts construction market, holding approximately 20% of the global share. Rapid urbanization, population growth, and government initiatives to improve infrastructure are key drivers of market expansion. Countries like China and India are investing heavily in construction projects, supported by favorable regulations and policies. China is the largest market in the region, followed by India, where local firms are increasingly adopting advanced construction technologies. The competitive landscape features both domestic and international players, including Jacobs Engineering Group and Tetra Tech, Inc., who are capitalizing on the growing demand for innovative construction solutions.

    Middle East and Africa : Resource-Rich Development Hub

    The Middle East and Africa region is witnessing a gradual increase in the struts construction market, accounting for about 5% of the global share. The growth is primarily driven by infrastructure development projects, particularly in the Gulf Cooperation Council (GCC) countries. Government investments in transportation and housing sectors are key regulatory catalysts for market expansion. Leading countries include the UAE and Saudi Arabia, where major construction firms are actively involved in large-scale projects. The competitive landscape is characterized by a mix of local and international players, with firms like McCarthy Building Companies, Inc. establishing a presence in the region. The focus on modernization and urban development presents significant growth opportunities.

    Key Players and Competitive Insights

    Leading market players are investing heavily in research and development in order to expand their product lines, which will help the Struts Construction market grow even more. Market participants are also undertaking a variety of strategic activities to expand their footprint, with important market developments including new product launches, contractual agreements, mergers and acquisitions, higher investments, and collaboration with other organizations. To expand and survive in a more competitive and rising market climate, the Struts Construction industry must offer cost-effective items.

    Manufacturing locally to minimize operational costs is one of the key business tactics used by manufacturers in the Struts Construction industry to benefit clients and increase the market sector. In recent years, the Struts Construction industry has offered some of the most significant advantages to medicine.

    Major players in the Struts Construction market, including Aetna Plastics Corp., Gregory Industries Inc., Hilti Corporation, ERICO Products Inc., Eaton Corporation Inc., Cooper Industries, Carpenter & Paterson, Inc., Unistrut Corporation, Atlas Supply Co., Guenther Supply, Inc., Enduro Pipeline Services Inc., and others, are attempting to increase market demand by investing in research and development operations.

    Stratasys Ltd. is a leading provider of 3D printing and additive manufacturing solutions. Founded in 1989 and headquartered in Eden Prairie, Minnesota, USA, Stratasys has established itself as a pioneer in the 3D printing industry. The company specializes in designing and manufacturing a wide range of 3D printers, including Fused Deposition Modeling (FDM) and PolyJet technologies, which are used for rapid prototyping, product design, and additive manufacturing in various industries. Stratasys serves a diverse customer base, including manufacturers, designers, engineers, and researchers across sectors such as aerospace, automotive, healthcare, and consumer goods.

    In August 2023, Stratasys, a leading provider of 3D printing solutions, and Autodesk, a leader in 3D design and engineering software, announced a partnership to develop and market new 3D printing solutions for strut construction. The partnership will combine Stratasys' expertise in 3D printing with Autodesk's expertise in 3D design and engineering to create solutions that enable the construction of more complex and efficient struts.

    Procore Technologies, Inc. is a prominent software company specializing in construction management and project management solutions. Founded in 2002 and headquartered in Carpinteria, California, USA, Procore has become a leader in the construction technology industry. The company provides cloud-based software that helps construction professionals streamline project management, collaboration, and communication, making it easier to oversee complex construction projects. In July 2023, Procore, a leading provider of construction management software, and Trimble, a leader in geospatial technology, announced a partnership to develop and market new integrated solutions for strut construction.

    The partnership will combine Procore's expertise in construction management software with Trimble's expertise in geospatial technology to create solutions that improve the efficiency and productivity of strut construction projects.

    Key Companies in the Struts Construction Market market include

    Industry Developments

    June 2023: Atlas Copco, a leading provider of industrial tools and equipment, acquired Gecotec, a leading provider of strut construction solutions. The acquisition will expand Atlas Copco's product portfolio in the strut construction market and enable it to offer more comprehensive solutions to its customers.

    May 2023: Hilti, a leading provider of fastening and anchoring systems, acquired Hilti India, its Indian subsidiary. The acquisition will strengthen Hilti's position in the Indian market and enable it to better serve its customers in the region.

    April 2023: Würth, a leading provider of assembly and fastening products, acquired Essve, a leading provider of strut construction solutions. The acquisition will expand Würth's product portfolio in the strut construction market and enable it to offer more comprehensive solutions to its customers.

    Future Outlook

    Struts Construction Market Future Outlook

    <p>The Struts Construction Market is projected to grow at a 5.12% CAGR from 2024 to 2035, driven by urbanization, infrastructure development, and technological advancements.</p>

    New opportunities lie in:

    • <p>Integration of smart technology in strut systems</p>
    • <p>Expansion into emerging markets with tailored solutions</p>
    • <p>Development of eco-friendly strut materials for sustainability</p>

    <p>By 2035, the Struts Construction Market is expected to achieve robust growth and enhanced competitive positioning.</p>

    Market Segmentation

    Struts Construction Material Outlook

    • Aluminum
    • Stainless Steel
    • Fiberglass

    Struts Construction Regional Outlook

    North America
    • US
    • Canada

    Struts Construction End User Outlook

    • Oil & Gas
    • Aerospace & Defense
    • Automotive
    • Others

    Struts Construction Sales Channel Outlook

    • OEM
    • Retail
    • E-Commerce

    Report Scope

    MARKET SIZE 202421.63(USD Billion)
    MARKET SIZE 202522.74(USD Billion)
    MARKET SIZE 203537.46(USD Billion)
    COMPOUND ANNUAL GROWTH RATE (CAGR)5.12% (2024 - 2035)
    REPORT COVERAGERevenue Forecast, Competitive Landscape, Growth Factors, and Trends
    BASE YEAR2024
    Market Forecast Period2025 - 2035
    Historical Data2019 - 2024
    Market Forecast UnitsUSD Billion
    Key Companies ProfiledMarket analysis in progress
    Segments CoveredMarket segmentation analysis in progress
    Key Market OpportunitiesIntegration of advanced materials and automation technologies enhances efficiency in the Struts Construction Market.
    Key Market DynamicsRising demand for sustainable materials drives innovation and competition in the Struts Construction Market.
    Countries CoveredNorth America, Europe, APAC, South America, MEA

    FAQs

    How much is the Struts Construction market?

    The Struts Construction market size was valued at USD 21.63 Billion in 2024.

    What is the growth rate of the Struts Construction market?

    Struts Construction Market is projected to grow at a CAGR of 5.12% during the forecast period, 2025-2035

    Which region held the largest market share in the Struts Construction market?

    North America had the largest share of the market

    Who are the key players in the Struts Construction market?

    The key players in the market are Aetna Plastics Corp., Gregory Industries Inc., Hilti Corporation ERICO Products Inc., Eaton Corporation Inc., Cooper Industries, Carpenter &amp; Paterson, Inc., Unistrut Corporation, Atlas Supply Co., Guenther Supply, Inc., Enduro Pipeline Services Inc.

    Which material led the Struts Construction market?

    The aluminum category dominated the market in 2024.

    Which sales channel had the largest market share in the Struts Construction market?

    The OEM had the largest share in the market.

    1. SECTION I: EXECUTIVE SUMMARY AND KEY HIGHLIGHTS
      1. | 1.1 EXECUTIVE SUMMARY
      2. | | 1.1.1 Market Overview
      3. | | 1.1.2 Key Findings
      4. | | 1.1.3 Market Segmentation
      5. | | 1.1.4 Competitive Landscape
      6. | | 1.1.5 Challenges and Opportunities
      7. | | 1.1.6 Future Outlook
    2. SECTION II: SCOPING, METHODOLOGY AND MARKET STRUCTURE
      1. | 2.1 MARKET INTRODUCTION
      2. | | 2.1.1 Definition
      3. | | 2.1.2 Scope of the study
      4. | | | 2.1.2.1 Research Objective
      5. | | | 2.1.2.2 Assumption
      6. | | | 2.1.2.3 Limitations
      7. | 2.2 RESEARCH METHODOLOGY
      8. | | 2.2.1 Overview
      9. | | 2.2.2 Data Mining
      10. | | 2.2.3 Secondary Research
      11. | | 2.2.4 Primary Research
      12. | | | 2.2.4.1 Primary Interviews and Information Gathering Process
      13. | | | 2.2.4.2 Breakdown of Primary Respondents
      14. | | 2.2.5 Forecasting Model
      15. | | 2.2.6 Market Size Estimation
      16. | | | 2.2.6.1 Bottom-Up Approach
      17. | | | 2.2.6.2 Top-Down Approach
      18. | | 2.2.7 Data Triangulation
      19. | | 2.2.8 Validation
    3. SECTION III: QUALITATIVE ANALYSIS
      1. | 3.1 MARKET DYNAMICS
      2. | | 3.1.1 Overview
      3. | | 3.1.2 Drivers
      4. | | 3.1.3 Restraints
      5. | | 3.1.4 Opportunities
      6. | 3.2 MARKET FACTOR ANALYSIS
      7. | | 3.2.1 Value chain Analysis
      8. | | 3.2.2 Porter's Five Forces Analysis
      9. | | | 3.2.2.1 Bargaining Power of Suppliers
      10. | | | 3.2.2.2 Bargaining Power of Buyers
      11. | | | 3.2.2.3 Threat of New Entrants
      12. | | | 3.2.2.4 Threat of Substitutes
      13. | | | 3.2.2.5 Intensity of Rivalry
      14. | | 3.2.3 COVID-19 Impact Analysis
      15. | | | 3.2.3.1 Market Impact Analysis
      16. | | | 3.2.3.2 Regional Impact
      17. | | | 3.2.3.3 Opportunity and Threat Analysis
    4. SECTION IV: QUANTITATIVE ANALYSIS
      1. | 4.1 Packaging & Transport, BY Material (USD Billion)
      2. | | 4.1.1 Aluminum
      3. | | 4.1.2 Stainless Steel
      4. | | 4.1.3 Fiberglass
      5. | 4.2 Packaging & Transport, BY End User (USD Billion)
      6. | | 4.2.1 Oil & Gas
      7. | | 4.2.2 Aerospace & Defense
      8. | | 4.2.3 Automotive
      9. | | 4.2.4 Others
      10. | 4.3 Packaging & Transport, BY Sales Channel (USD Billion)
      11. | | 4.3.1 OEM
      12. | | 4.3.2 Retail
      13. | | 4.3.3 E-Commerce
      14. | 4.4 Packaging & Transport, BY Region (USD Billion)
      15. | | 4.4.1 North America
      16. | | | 4.4.1.1 US
      17. | | | 4.4.1.2 Canada
      18. | | 4.4.2 Europe
      19. | | | 4.4.2.1 Germany
      20. | | | 4.4.2.2 UK
      21. | | | 4.4.2.3 France
      22. | | | 4.4.2.4 Russia
      23. | | | 4.4.2.5 Italy
      24. | | | 4.4.2.6 Spain
      25. | | | 4.4.2.7 Rest of Europe
      26. | | 4.4.3 APAC
      27. | | | 4.4.3.1 China
      28. | | | 4.4.3.2 India
      29. | | | 4.4.3.3 Japan
      30. | | | 4.4.3.4 South Korea
      31. | | | 4.4.3.5 Malaysia
      32. | | | 4.4.3.6 Thailand
      33. | | | 4.4.3.7 Indonesia
      34. | | | 4.4.3.8 Rest of APAC
      35. | | 4.4.4 South America
      36. | | | 4.4.4.1 Brazil
      37. | | | 4.4.4.2 Mexico
      38. | | | 4.4.4.3 Argentina
      39. | | | 4.4.4.4 Rest of South America
      40. | | 4.4.5 MEA
      41. | | | 4.4.5.1 GCC Countries
      42. | | | 4.4.5.2 South Africa
      43. | | | 4.4.5.3 Rest of MEA
    5. SECTION V: COMPETITIVE ANALYSIS
      1. | 5.1 Competitive Landscape
      2. | | 5.1.1 Overview
      3. | | 5.1.2 Competitive Analysis
      4. | | 5.1.3 Market share Analysis
      5. | | 5.1.4 Major Growth Strategy in the Packaging & Transport
      6. | | 5.1.5 Competitive Benchmarking
      7. | | 5.1.6 Leading Players in Terms of Number of Developments in the Packaging & Transport
      8. | | 5.1.7 Key developments and growth strategies
      9. | | | 5.1.7.1 New Product Launch/Service Deployment
      10. | | | 5.1.7.2 Merger & Acquisitions
      11. | | | 5.1.7.3 Joint Ventures
      12. | | 5.1.8 Major Players Financial Matrix
      13. | | | 5.1.8.1 Sales and Operating Income
      14. | | | 5.1.8.2 Major Players R&D Expenditure. 2023
      15. | 5.2 Company Profiles
      16. | | 5.2.1 Bechtel Corporation (US)
      17. | | | 5.2.1.1 Financial Overview
      18. | | | 5.2.1.2 Products Offered
      19. | | | 5.2.1.3 Key Developments
      20. | | | 5.2.1.4 SWOT Analysis
      21. | | | 5.2.1.5 Key Strategies
      22. | | 5.2.2 Fluor Corporation (US)
      23. | | | 5.2.2.1 Financial Overview
      24. | | | 5.2.2.2 Products Offered
      25. | | | 5.2.2.3 Key Developments
      26. | | | 5.2.2.4 SWOT Analysis
      27. | | | 5.2.2.5 Key Strategies
      28. | | 5.2.3 Kiewit Corporation (US)
      29. | | | 5.2.3.1 Financial Overview
      30. | | | 5.2.3.2 Products Offered
      31. | | | 5.2.3.3 Key Developments
      32. | | | 5.2.3.4 SWOT Analysis
      33. | | | 5.2.3.5 Key Strategies
      34. | | 5.2.4 Skanska AB (SE)
      35. | | | 5.2.4.1 Financial Overview
      36. | | | 5.2.4.2 Products Offered
      37. | | | 5.2.4.3 Key Developments
      38. | | | 5.2.4.4 SWOT Analysis
      39. | | | 5.2.4.5 Key Strategies
      40. | | 5.2.5 Balfour Beatty plc (GB)
      41. | | | 5.2.5.1 Financial Overview
      42. | | | 5.2.5.2 Products Offered
      43. | | | 5.2.5.3 Key Developments
      44. | | | 5.2.5.4 SWOT Analysis
      45. | | | 5.2.5.5 Key Strategies
      46. | | 5.2.6 Jacobs Engineering Group (US)
      47. | | | 5.2.6.1 Financial Overview
      48. | | | 5.2.6.2 Products Offered
      49. | | | 5.2.6.3 Key Developments
      50. | | | 5.2.6.4 SWOT Analysis
      51. | | | 5.2.6.5 Key Strategies
      52. | | 5.2.7 Tetra Tech, Inc. (US)
      53. | | | 5.2.7.1 Financial Overview
      54. | | | 5.2.7.2 Products Offered
      55. | | | 5.2.7.3 Key Developments
      56. | | | 5.2.7.4 SWOT Analysis
      57. | | | 5.2.7.5 Key Strategies
      58. | | 5.2.8 McCarthy Building Companies, Inc. (US)
      59. | | | 5.2.8.1 Financial Overview
      60. | | | 5.2.8.2 Products Offered
      61. | | | 5.2.8.3 Key Developments
      62. | | | 5.2.8.4 SWOT Analysis
      63. | | | 5.2.8.5 Key Strategies
      64. | 5.3 Appendix
      65. | | 5.3.1 References
      66. | | 5.3.2 Related Reports
    6. LIST OF FIGURES
      1. | 6.1 MARKET SYNOPSIS
      2. | 6.2 NORTH AMERICA MARKET ANALYSIS
      3. | 6.3 US MARKET ANALYSIS BY MATERIAL
      4. | 6.4 US MARKET ANALYSIS BY END USER
      5. | 6.5 US MARKET ANALYSIS BY SALES CHANNEL
      6. | 6.6 CANADA MARKET ANALYSIS BY MATERIAL
      7. | 6.7 CANADA MARKET ANALYSIS BY END USER
      8. | 6.8 CANADA MARKET ANALYSIS BY SALES CHANNEL
      9. | 6.9 EUROPE MARKET ANALYSIS
      10. | 6.10 GERMANY MARKET ANALYSIS BY MATERIAL
      11. | 6.11 GERMANY MARKET ANALYSIS BY END USER
      12. | 6.12 GERMANY MARKET ANALYSIS BY SALES CHANNEL
      13. | 6.13 UK MARKET ANALYSIS BY MATERIAL
      14. | 6.14 UK MARKET ANALYSIS BY END USER
      15. | 6.15 UK MARKET ANALYSIS BY SALES CHANNEL
      16. | 6.16 FRANCE MARKET ANALYSIS BY MATERIAL
      17. | 6.17 FRANCE MARKET ANALYSIS BY END USER
      18. | 6.18 FRANCE MARKET ANALYSIS BY SALES CHANNEL
      19. | 6.19 RUSSIA MARKET ANALYSIS BY MATERIAL
      20. | 6.20 RUSSIA MARKET ANALYSIS BY END USER
      21. | 6.21 RUSSIA MARKET ANALYSIS BY SALES CHANNEL
      22. | 6.22 ITALY MARKET ANALYSIS BY MATERIAL
      23. | 6.23 ITALY MARKET ANALYSIS BY END USER
      24. | 6.24 ITALY MARKET ANALYSIS BY SALES CHANNEL
      25. | 6.25 SPAIN MARKET ANALYSIS BY MATERIAL
      26. | 6.26 SPAIN MARKET ANALYSIS BY END USER
      27. | 6.27 SPAIN MARKET ANALYSIS BY SALES CHANNEL
      28. | 6.28 REST OF EUROPE MARKET ANALYSIS BY MATERIAL
      29. | 6.29 REST OF EUROPE MARKET ANALYSIS BY END USER
      30. | 6.30 REST OF EUROPE MARKET ANALYSIS BY SALES CHANNEL
      31. | 6.31 APAC MARKET ANALYSIS
      32. | 6.32 CHINA MARKET ANALYSIS BY MATERIAL
      33. | 6.33 CHINA MARKET ANALYSIS BY END USER
      34. | 6.34 CHINA MARKET ANALYSIS BY SALES CHANNEL
      35. | 6.35 INDIA MARKET ANALYSIS BY MATERIAL
      36. | 6.36 INDIA MARKET ANALYSIS BY END USER
      37. | 6.37 INDIA MARKET ANALYSIS BY SALES CHANNEL
      38. | 6.38 JAPAN MARKET ANALYSIS BY MATERIAL
      39. | 6.39 JAPAN MARKET ANALYSIS BY END USER
      40. | 6.40 JAPAN MARKET ANALYSIS BY SALES CHANNEL
      41. | 6.41 SOUTH KOREA MARKET ANALYSIS BY MATERIAL
      42. | 6.42 SOUTH KOREA MARKET ANALYSIS BY END USER
      43. | 6.43 SOUTH KOREA MARKET ANALYSIS BY SALES CHANNEL
      44. | 6.44 MALAYSIA MARKET ANALYSIS BY MATERIAL
      45. | 6.45 MALAYSIA MARKET ANALYSIS BY END USER
      46. | 6.46 MALAYSIA MARKET ANALYSIS BY SALES CHANNEL
      47. | 6.47 THAILAND MARKET ANALYSIS BY MATERIAL
      48. | 6.48 THAILAND MARKET ANALYSIS BY END USER
      49. | 6.49 THAILAND MARKET ANALYSIS BY SALES CHANNEL
      50. | 6.50 INDONESIA MARKET ANALYSIS BY MATERIAL
      51. | 6.51 INDONESIA MARKET ANALYSIS BY END USER
      52. | 6.52 INDONESIA MARKET ANALYSIS BY SALES CHANNEL
      53. | 6.53 REST OF APAC MARKET ANALYSIS BY MATERIAL
      54. | 6.54 REST OF APAC MARKET ANALYSIS BY END USER
      55. | 6.55 REST OF APAC MARKET ANALYSIS BY SALES CHANNEL
      56. | 6.56 SOUTH AMERICA MARKET ANALYSIS
      57. | 6.57 BRAZIL MARKET ANALYSIS BY MATERIAL
      58. | 6.58 BRAZIL MARKET ANALYSIS BY END USER
      59. | 6.59 BRAZIL MARKET ANALYSIS BY SALES CHANNEL
      60. | 6.60 MEXICO MARKET ANALYSIS BY MATERIAL
      61. | 6.61 MEXICO MARKET ANALYSIS BY END USER
      62. | 6.62 MEXICO MARKET ANALYSIS BY SALES CHANNEL
      63. | 6.63 ARGENTINA MARKET ANALYSIS BY MATERIAL
      64. | 6.64 ARGENTINA MARKET ANALYSIS BY END USER
      65. | 6.65 ARGENTINA MARKET ANALYSIS BY SALES CHANNEL
      66. | 6.66 REST OF SOUTH AMERICA MARKET ANALYSIS BY MATERIAL
      67. | 6.67 REST OF SOUTH AMERICA MARKET ANALYSIS BY END USER
      68. | 6.68 REST OF SOUTH AMERICA MARKET ANALYSIS BY SALES CHANNEL
      69. | 6.69 MEA MARKET ANALYSIS
      70. | 6.70 GCC COUNTRIES MARKET ANALYSIS BY MATERIAL
      71. | 6.71 GCC COUNTRIES MARKET ANALYSIS BY END USER
      72. | 6.72 GCC COUNTRIES MARKET ANALYSIS BY SALES CHANNEL
      73. | 6.73 SOUTH AFRICA MARKET ANALYSIS BY MATERIAL
      74. | 6.74 SOUTH AFRICA MARKET ANALYSIS BY END USER
      75. | 6.75 SOUTH AFRICA MARKET ANALYSIS BY SALES CHANNEL
      76. | 6.76 REST OF MEA MARKET ANALYSIS BY MATERIAL
      77. | 6.77 REST OF MEA MARKET ANALYSIS BY END USER
      78. | 6.78 REST OF MEA MARKET ANALYSIS BY SALES CHANNEL
      79. | 6.79 KEY BUYING CRITERIA OF PACKAGING & TRANSPORT
      80. | 6.80 RESEARCH PROCESS OF MRFR
      81. | 6.81 DRO ANALYSIS OF PACKAGING & TRANSPORT
      82. | 6.82 DRIVERS IMPACT ANALYSIS: PACKAGING & TRANSPORT
      83. | 6.83 RESTRAINTS IMPACT ANALYSIS: PACKAGING & TRANSPORT
      84. | 6.84 SUPPLY / VALUE CHAIN: PACKAGING & TRANSPORT
      85. | 6.85 PACKAGING & TRANSPORT, BY MATERIAL, 2024 (% SHARE)
      86. | 6.86 PACKAGING & TRANSPORT, BY MATERIAL, 2024 TO 2035 (USD Billion)
      87. | 6.87 PACKAGING & TRANSPORT, BY END USER, 2024 (% SHARE)
      88. | 6.88 PACKAGING & TRANSPORT, BY END USER, 2024 TO 2035 (USD Billion)
      89. | 6.89 PACKAGING & TRANSPORT, BY SALES CHANNEL, 2024 (% SHARE)
      90. | 6.90 PACKAGING & TRANSPORT, BY SALES CHANNEL, 2024 TO 2035 (USD Billion)
      91. | 6.91 BENCHMARKING OF MAJOR COMPETITORS
    7. LIST OF TABLES
      1. | 7.1 LIST OF ASSUMPTIONS
      2. | | 7.1.1
      3. | 7.2 North America MARKET SIZE ESTIMATES; FORECAST
      4. | | 7.2.1 BY MATERIAL, 2025-2035 (USD Billion)
      5. | | 7.2.2 BY END USER, 2025-2035 (USD Billion)
      6. | | 7.2.3 BY SALES CHANNEL, 2025-2035 (USD Billion)
      7. | 7.3 US MARKET SIZE ESTIMATES; FORECAST
      8. | | 7.3.1 BY MATERIAL, 2025-2035 (USD Billion)
      9. | | 7.3.2 BY END USER, 2025-2035 (USD Billion)
      10. | | 7.3.3 BY SALES CHANNEL, 2025-2035 (USD Billion)
      11. | 7.4 Canada MARKET SIZE ESTIMATES; FORECAST
      12. | | 7.4.1 BY MATERIAL, 2025-2035 (USD Billion)
      13. | | 7.4.2 BY END USER, 2025-2035 (USD Billion)
      14. | | 7.4.3 BY SALES CHANNEL, 2025-2035 (USD Billion)
      15. | 7.5 Europe MARKET SIZE ESTIMATES; FORECAST
      16. | | 7.5.1 BY MATERIAL, 2025-2035 (USD Billion)
      17. | | 7.5.2 BY END USER, 2025-2035 (USD Billion)
      18. | | 7.5.3 BY SALES CHANNEL, 2025-2035 (USD Billion)
      19. | 7.6 Germany MARKET SIZE ESTIMATES; FORECAST
      20. | | 7.6.1 BY MATERIAL, 2025-2035 (USD Billion)
      21. | | 7.6.2 BY END USER, 2025-2035 (USD Billion)
      22. | | 7.6.3 BY SALES CHANNEL, 2025-2035 (USD Billion)
      23. | 7.7 UK MARKET SIZE ESTIMATES; FORECAST
      24. | | 7.7.1 BY MATERIAL, 2025-2035 (USD Billion)
      25. | | 7.7.2 BY END USER, 2025-2035 (USD Billion)
      26. | | 7.7.3 BY SALES CHANNEL, 2025-2035 (USD Billion)
      27. | 7.8 France MARKET SIZE ESTIMATES; FORECAST
      28. | | 7.8.1 BY MATERIAL, 2025-2035 (USD Billion)
      29. | | 7.8.2 BY END USER, 2025-2035 (USD Billion)
      30. | | 7.8.3 BY SALES CHANNEL, 2025-2035 (USD Billion)
      31. | 7.9 Russia MARKET SIZE ESTIMATES; FORECAST
      32. | | 7.9.1 BY MATERIAL, 2025-2035 (USD Billion)
      33. | | 7.9.2 BY END USER, 2025-2035 (USD Billion)
      34. | | 7.9.3 BY SALES CHANNEL, 2025-2035 (USD Billion)
      35. | 7.10 Italy MARKET SIZE ESTIMATES; FORECAST
      36. | | 7.10.1 BY MATERIAL, 2025-2035 (USD Billion)
      37. | | 7.10.2 BY END USER, 2025-2035 (USD Billion)
      38. | | 7.10.3 BY SALES CHANNEL, 2025-2035 (USD Billion)
      39. | 7.11 Spain MARKET SIZE ESTIMATES; FORECAST
      40. | | 7.11.1 BY MATERIAL, 2025-2035 (USD Billion)
      41. | | 7.11.2 BY END USER, 2025-2035 (USD Billion)
      42. | | 7.11.3 BY SALES CHANNEL, 2025-2035 (USD Billion)
      43. | 7.12 Rest of Europe MARKET SIZE ESTIMATES; FORECAST
      44. | | 7.12.1 BY MATERIAL, 2025-2035 (USD Billion)
      45. | | 7.12.2 BY END USER, 2025-2035 (USD Billion)
      46. | | 7.12.3 BY SALES CHANNEL, 2025-2035 (USD Billion)
      47. | 7.13 APAC MARKET SIZE ESTIMATES; FORECAST
      48. | | 7.13.1 BY MATERIAL, 2025-2035 (USD Billion)
      49. | | 7.13.2 BY END USER, 2025-2035 (USD Billion)
      50. | | 7.13.3 BY SALES CHANNEL, 2025-2035 (USD Billion)
      51. | 7.14 China MARKET SIZE ESTIMATES; FORECAST
      52. | | 7.14.1 BY MATERIAL, 2025-2035 (USD Billion)
      53. | | 7.14.2 BY END USER, 2025-2035 (USD Billion)
      54. | | 7.14.3 BY SALES CHANNEL, 2025-2035 (USD Billion)
      55. | 7.15 India MARKET SIZE ESTIMATES; FORECAST
      56. | | 7.15.1 BY MATERIAL, 2025-2035 (USD Billion)
      57. | | 7.15.2 BY END USER, 2025-2035 (USD Billion)
      58. | | 7.15.3 BY SALES CHANNEL, 2025-2035 (USD Billion)
      59. | 7.16 Japan MARKET SIZE ESTIMATES; FORECAST
      60. | | 7.16.1 BY MATERIAL, 2025-2035 (USD Billion)
      61. | | 7.16.2 BY END USER, 2025-2035 (USD Billion)
      62. | | 7.16.3 BY SALES CHANNEL, 2025-2035 (USD Billion)
      63. | 7.17 South Korea MARKET SIZE ESTIMATES; FORECAST
      64. | | 7.17.1 BY MATERIAL, 2025-2035 (USD Billion)
      65. | | 7.17.2 BY END USER, 2025-2035 (USD Billion)
      66. | | 7.17.3 BY SALES CHANNEL, 2025-2035 (USD Billion)
      67. | 7.18 Malaysia MARKET SIZE ESTIMATES; FORECAST
      68. | | 7.18.1 BY MATERIAL, 2025-2035 (USD Billion)
      69. | | 7.18.2 BY END USER, 2025-2035 (USD Billion)
      70. | | 7.18.3 BY SALES CHANNEL, 2025-2035 (USD Billion)
      71. | 7.19 Thailand MARKET SIZE ESTIMATES; FORECAST
      72. | | 7.19.1 BY MATERIAL, 2025-2035 (USD Billion)
      73. | | 7.19.2 BY END USER, 2025-2035 (USD Billion)
      74. | | 7.19.3 BY SALES CHANNEL, 2025-2035 (USD Billion)
      75. | 7.20 Indonesia MARKET SIZE ESTIMATES; FORECAST
      76. | | 7.20.1 BY MATERIAL, 2025-2035 (USD Billion)
      77. | | 7.20.2 BY END USER, 2025-2035 (USD Billion)
      78. | | 7.20.3 BY SALES CHANNEL, 2025-2035 (USD Billion)
      79. | 7.21 Rest of APAC MARKET SIZE ESTIMATES; FORECAST
      80. | | 7.21.1 BY MATERIAL, 2025-2035 (USD Billion)
      81. | | 7.21.2 BY END USER, 2025-2035 (USD Billion)
      82. | | 7.21.3 BY SALES CHANNEL, 2025-2035 (USD Billion)
      83. | 7.22 South America MARKET SIZE ESTIMATES; FORECAST
      84. | | 7.22.1 BY MATERIAL, 2025-2035 (USD Billion)
      85. | | 7.22.2 BY END USER, 2025-2035 (USD Billion)
      86. | | 7.22.3 BY SALES CHANNEL, 2025-2035 (USD Billion)
      87. | 7.23 Brazil MARKET SIZE ESTIMATES; FORECAST
      88. | | 7.23.1 BY MATERIAL, 2025-2035 (USD Billion)
      89. | | 7.23.2 BY END USER, 2025-2035 (USD Billion)
      90. | | 7.23.3 BY SALES CHANNEL, 2025-2035 (USD Billion)
      91. | 7.24 Mexico MARKET SIZE ESTIMATES; FORECAST
      92. | | 7.24.1 BY MATERIAL, 2025-2035 (USD Billion)
      93. | | 7.24.2 BY END USER, 2025-2035 (USD Billion)
      94. | | 7.24.3 BY SALES CHANNEL, 2025-2035 (USD Billion)
      95. | 7.25 Argentina MARKET SIZE ESTIMATES; FORECAST
      96. | | 7.25.1 BY MATERIAL, 2025-2035 (USD Billion)
      97. | | 7.25.2 BY END USER, 2025-2035 (USD Billion)
      98. | | 7.25.3 BY SALES CHANNEL, 2025-2035 (USD Billion)
      99. | 7.26 Rest of South America MARKET SIZE ESTIMATES; FORECAST
      100. | | 7.26.1 BY MATERIAL, 2025-2035 (USD Billion)
      101. | | 7.26.2 BY END USER, 2025-2035 (USD Billion)
      102. | | 7.26.3 BY SALES CHANNEL, 2025-2035 (USD Billion)
      103. | 7.27 MEA MARKET SIZE ESTIMATES; FORECAST
      104. | | 7.27.1 BY MATERIAL, 2025-2035 (USD Billion)
      105. | | 7.27.2 BY END USER, 2025-2035 (USD Billion)
      106. | | 7.27.3 BY SALES CHANNEL, 2025-2035 (USD Billion)
      107. | 7.28 GCC Countries MARKET SIZE ESTIMATES; FORECAST
      108. | | 7.28.1 BY MATERIAL, 2025-2035 (USD Billion)
      109. | | 7.28.2 BY END USER, 2025-2035 (USD Billion)
      110. | | 7.28.3 BY SALES CHANNEL, 2025-2035 (USD Billion)
      111. | 7.29 South Africa MARKET SIZE ESTIMATES; FORECAST
      112. | | 7.29.1 BY MATERIAL, 2025-2035 (USD Billion)
      113. | | 7.29.2 BY END USER, 2025-2035 (USD Billion)
      114. | | 7.29.3 BY SALES CHANNEL, 2025-2035 (USD Billion)
      115. | 7.30 Rest of MEA MARKET SIZE ESTIMATES; FORECAST
      116. | | 7.30.1 BY MATERIAL, 2025-2035 (USD Billion)
      117. | | 7.30.2 BY END USER, 2025-2035 (USD Billion)
      118. | | 7.30.3 BY SALES CHANNEL, 2025-2035 (USD Billion)
      119. | 7.31 PRODUCT LAUNCH/PRODUCT DEVELOPMENT/APPROVAL
      120. | | 7.31.1
      121. | 7.32 ACQUISITION/PARTNERSHIP
      122. | | 7.32.1

    Struts Construction Market Segmentation

    Market Segmentation Overview

    • Detailed segmentation data will be available in the full report
    • Comprehensive analysis by multiple parameters
    • Regional and country-level breakdowns
    • Market size forecasts by segment
    Infographic

    Free Sample Request

    Kindly complete the form below to receive a free sample of this Report

    Get Free Sample

    Customer Strories

    “I am very pleased with how market segments have been defined in a relevant way for my purposes (such as "Portable Freezers & refrigerators" and "last-mile"). In general the report is well structured. Thanks very much for your efforts.”

    Victoria Milne

    Founder
    Case Study
    Chemicals and Materials

    Compare Licence

    ×
    Features License Type
    Single User Multiuser License Enterprise User
    Price $4,950 $5,950 $7,250
    Maximum User Access Limit 1 User Upto 10 Users Unrestricted Access Throughout the Organization
    Free Customization
    Direct Access to Analyst
    Deliverable Format
    Platform Access
    Discount on Next Purchase 10% 15% 15%
    Printable Versions