Spark Plugs Market Summary
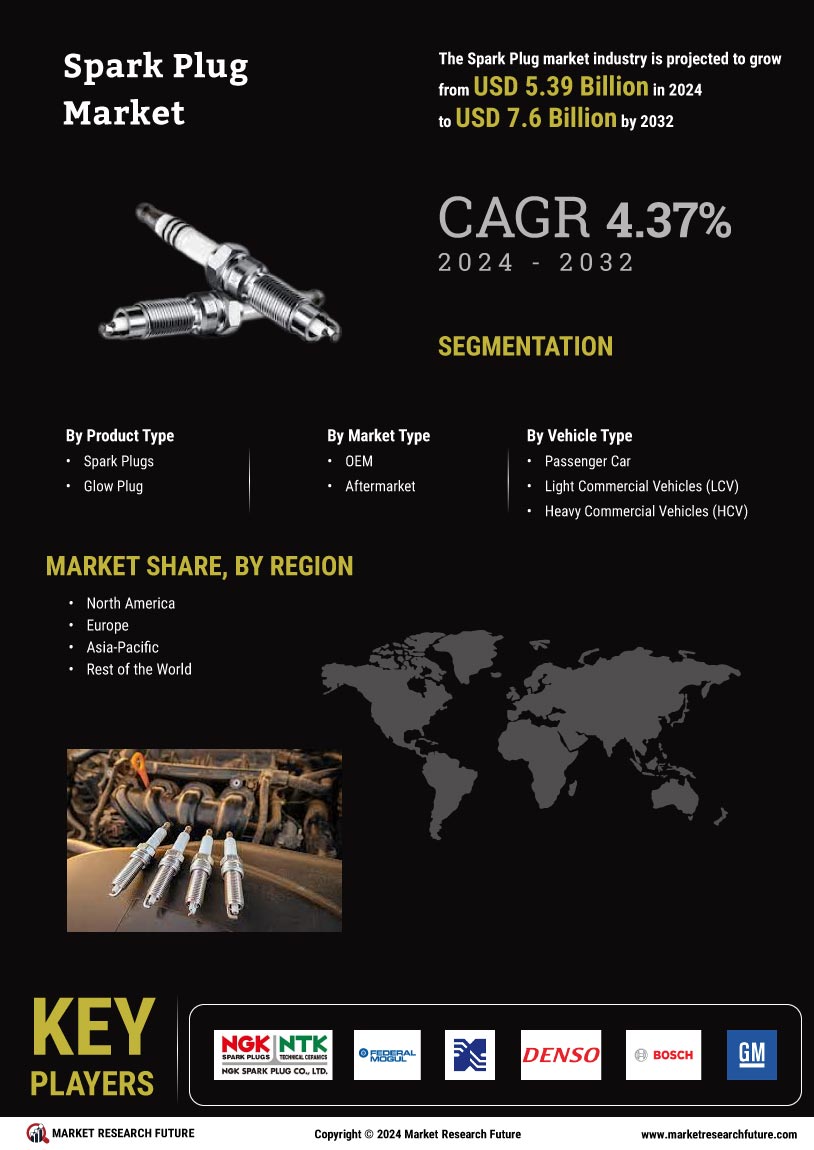
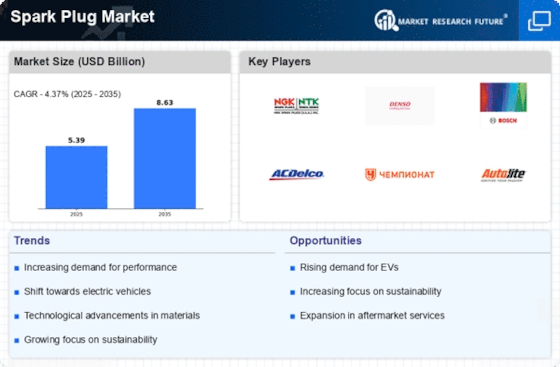
As per MRFR Analysis, the Global Spark Plug Market was valued at 4.07 USD Billion in 2023 and is projected to grow to 5 USD Billion by 2035, with a CAGR of 1.73% from 2025 to 2035. The market is driven by the increasing demand for fuel-efficient vehicles, technological advancements in spark plug manufacturing, and the growth of the automotive aftermarket. Key players like NGK Spark Plug Co. and Denso Corporation are leading innovations in spark plug technology, enhancing performance and durability.
Key Market Trends & Highlights
The Spark Plug Market is witnessing transformative changes driven by several key trends.
- Market Size in 2024: USD 4.14 Billion; expected to reach USD 5 Billion by 2035.
- Copper spark plugs valued at USD 1.34 Billion in 2024; Iridium spark plugs at USD 1.4 Billion.
- Aftermarket sector projected to grow significantly due to increasing vehicle ownership and maintenance needs.
- APAC region to dominate market with a valuation of USD 1.208 Billion in 2024, growing to USD 1.458 Billion by 2035.
Market Size & Forecast
2023 Market Size: USD 4.07 Billion
2024 Market Size: USD 4.14 Billion
2035 Market Size: USD 5 Billion
CAGR (2025-2035): 1.73%
Largest Regional Market Share in 2024: APAC.
Major Players
NGK Spark Plug Co., Denso Corporation, Champion, Valeo, Magneti Marelli, Aisin Seiki, ACDelco, FederalMogul, Hella, Delphi Technologies, Edelbrock, BorgWarner, E3 Spark Plugs, SKP, Bosch.
Key Spark Plug Market Trends Highlighted
The Spark Plug Market is seeing some interesting changes because of new technologies in cars and a growing need for cars that use less gas. One of the main things driving the market is the increased demand for electric vehicles (EVs) and hybrid cars. Manufacturers are looking for spark plugs that work with these new powertrains. This change is in line with initiatives throughout the world to cut down on emissions and make engines more efficient by making them smaller. There is also a growing need for high-performance spark plugs, especially in places where motorsports are popular and performance and reliability are very important.
There are many chances to make money by making new spark plug technologies, such as iridium and platinum spark plugs, which last longer and start engines better. As car companies add more complex engine designs, such as turbocharging and direct fuel injection, the requirement for spark plugs that can handle greater temperatures and pressures grows. Regional rules that encourage cleaner fuels also provide manufacturers a chance to make spark plugs that make the most of fuel combustion, which will boost sales in the market. Recent trends show that the supply chain is becoming more focused on sustainability, with manufacturers attempting to make their processes and products more environmentally friendly.
Government rules that stress lowering carbon footprints and customers being more aware of eco-friendly automobile options are two things that have an effect on this. The Spark Plug Market is ready for big growth since more people are buying cars and more cars are being made in developing regions. This means that firms need to come up with new ideas and change their products to satisfy changing customer and regulatory needs.

Source: Primary Research, Secondary Research, MRFR Database and Analyst Review
Spark Plug Market Drivers
Increasing Demand for Fuel-Efficient Vehicles
The Spark Plug Market Industry is experiencing growth due to a rising demand for fuel-efficient vehicles. Governments around the world are implementing stricter emission regulations, prompting automotive manufacturers to enhance engine efficiency. For instance, the European Parliament has set ambitious targets to reduce carbon dioxide emissions, aiming to achieve a 55% reduction from 2021 levels by 2030. This regulation encourages manufacturers to adopt advanced technologies, including improved spark plugs that optimize fuel combustion and overall vehicle performance.
Organizations like the International Organization of Motor Vehicle Manufacturers highlight that improved spark plugs contribute to better combustion efficiency, leading to reduced fuel consumption and lower emissions. As global vehicle manufacturing shifts toward greener technologies, the demand for high-quality spark plugs is expected to rise, driving overall market growth.
Advancements in Spark Plug Technology
The ongoing Research and Development activities in spark plug technologies significantly contribute to the growth of the Spark Plug Market Industry. Innovations such as iridium and platinum spark plugs offer enhanced durability and performance advantages over conventional copper spark plugs. For instance, companies like NGK Spark Plug and Denso are investing heavily in new inventions, leading to products that last longer and offer better ignition performance.
This technological advancement aligns with rising consumer preferences for dependable automotive performance. Research published by the Society of Automotive Engineers suggests that the adoption of high-performance spark plugs can improve engine efficiency by up to 10%, indicating a strong growth potential in the market as enhanced products become more widely adopted.
Rise in Automotive Production
The growth of the Spark Plug Market Industry is also linked to the increasing production of automobiles worldwide. According to the International Organization of Motor Vehicle Manufacturers, the global production of cars reached approximately 77 million units in 2021 and is forecasted to continue rising, particularly in emerging markets such as India and China. As the number of vehicles produced increases, the demand for essential components like spark plugs naturally follows suit.
Industry leaders who are ramping up production, like Ford and Toyota, acknowledge this trend and are investing in their supply chain to meet the growing demand, further exacerbating the need for high-quality spark plugs in the automotive industry.
Spark Plug Market Segment Insights:
Spark Plug Market Type Insights
The Spark Plug Market is experiencing steady growth, particularly in its Type segment, which includes Copper, Platinum, Iridium, and Double Platinum. As of 2024, the market is valued at 4.14 USD Billion, demonstrating a shift towards durable and performance-oriented spark plugs. Among these types, Copper spark plugs are projected to be valued at 1.1 USD Billion in 2024 and are anticipated to reach 1.3 USD Billion by 2035, showcasing their continued importance in the market due to their affordability and effective performance in specific vehicle models.
Similarly, Platinum spark plugs are significant, valued at 1.2 USD Billion in 2024 and estimated to grow to 1.4 USD Billion by 2035. Their ability to provide a longer lifespan and improved fuel efficiency makes them a preferred choice for many vehicle manufacturers. Iridium spark plugs, holding a market value of 1.3 USD Billion in 2024, are expected to rise to 1.6 USD Billion by 2035, reflecting their dominance in high-performance and luxury vehicles due to superior durability and better heat resistance. This segment is increasingly appealing to consumers seeking reliability and efficiency in engine performance.
In contrast, Double Platinum spark plugs have a smaller market footprint, valued at 0.54 USD Billion in 2024 with growth to 0.7 USD Billion by 2035, serving a niche market that values their dual platinum construction, which provides better conductivity and longevity. The rising need for high-efficiency vehicles and advancements in spark plug technology is driving the demand across all these types. The Spark Plug Market segmentation reflects not only the technological advancements in ignition systems but also the evolving preferences of consumers, thus offering a full array of options that cater to various automotive needs while influencing market growth accordingly.
Overall, the varying valuations across these types highlight their unique attributes and market positions, with some types holding a majority share while others cater to specific performance requirements.

Source: Primary Research, Secondary Research, MRFR Database and Analyst Review
Spark Plug Market Application Insights
The Spark Plug Market, valued at 4.14 USD billion in 2024, showcases a diverse application landscape primarily segmented into areas such as Automotive, Motorcycle, Small Engine, and Marine. The automotive sector stands out as a principal driver due to the increasing production of vehicles, which significantly contributes to Spark Plug Market revenue. This is followed closely by the motorcycle market, which captures a notable share owing to the rising demand for two-wheelers in urban areas, especially in developing countries. Small engines are increasingly employed in power equipment and lawn care devices, reflecting a strong growth trend in consumer interest for gardening and maintenance products.
Meanwhile, the marine application holds importance as it ensures efficient propulsion performance in various watercraft, driven by heightened recreational boating activities worldwide. Collectively, these applications drive substantial growth within the Spark Plug Market industry, leveraging technological advancements and enhancing engine performance while addressing environmental regulations. The market growth potential is further underscored by the necessity for efficient fuel consumption and adherence to emission standards, fostering opportunities for innovation and development in spark plug technology.
Spark Plug Market End Use Insights
The Spark Plug Market is a crucial component of the automotive industry, driven by its significant applications in various end-use sectors. By 2024, the overall market is expected to reach a value of 4.14 billion USD, reflecting the need for automotive solutions. The market segmentation primarily involves Original Equipment Manufacturer (OEM) and Aftermarket categories, each playing an essential role in the overall landscape. The OEM segment remains critical as vehicle manufacturers continuously seek high-performance spark plugs to enhance engine efficiency and reduce emissions, thus influencing market growth.
Meanwhile, the Aftermarket category is significant, catering to the increasing number of vehicle owners looking for replacements and upgrades, driven by trends indicating extended vehicle lifespan and rising vehicle ownership globally. The importance of these segments is underscored by the need for reliable and durable spark plugs that contribute to engine performance and longevity. Addressing evolving consumer demands while navigating challenges such as price fluctuations and technological advancements presents both opportunities and hurdles in the Spark Plug Market revenue growth.
With projected growth outcomes, understanding these segments enhances strategic decision-making in this evolving market landscape.
Spark Plug Market Fuel Type Insights
The Spark Plug Market showcases a diverse range of fuel types, with significant contributions from gasoline, diesel, ethanol, and LPG. As of 2024, the overall market is projected to be valued at 4.14 billion USD, reflecting a steady growth trajectory in the automotive sector. Gasoline spark plugs continue to dominate due to their widespread use in passenger vehicles, while diesel spark plugs play a critical role in enhancing the performance of heavy-duty engines. Ethanol and LPG spark plugs are gaining traction, driven by the increasing shift towards alternative fuels in a bid to reduce emissions and promote sustainability.
This market segmentation presents vast opportunities for growth as manufacturers innovate to meet the evolving demands for efficiency and eco-friendliness. Recent trends show a growing preference for more efficient ignition systems that can operate effectively across different fuel types, aligning with global sustainability goals. The challenges related to the supply chain and raw material costs are also pivotal factors influencing the market's landscape, adding complexity to the dynamics of the Spark Plug Market. Ultimately, this segment's diversity is crucial in shaping the industry's future as it adapts to changing automotive trends and consumer preferences.
Spark Plug Market Regional Insights
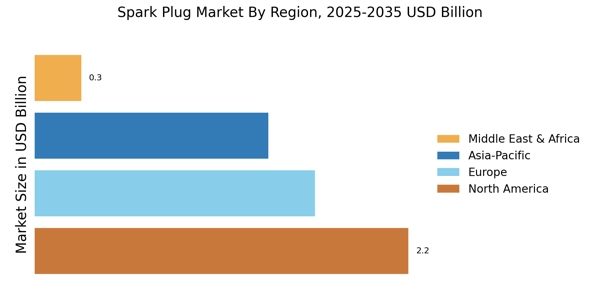
The Spark Plug Market exhibits diverse valuations across various regions in 2024, with a total expected market value of 4.14 USD Billion. In North America, the market is valued at 0.967 USD Billion, accounting for a significant share, driven by the automobile industry's robust demand and advanced vehicle technologies. Europe follows closely with a value of 0.886 USD Billion, supported by strong automotive manufacturing sectors and a growing trend towards electric vehicles. South America features a market valuation of 0.403 USD Billion, primarily influenced by the rising automotive population and increased consumer spending.
Asia Pacific dominates the market with a substantial valuation of 1.45 USD Billion in 2024, reflecting a significant automotive production hub and heightened demand for vehicle maintenance. Meanwhile, the Middle East and Africa hold a market value of 0.435 USD Billion, where growing automotive infrastructure and rising vehicle ownership present opportunities for future growth. As the Spark Plug Market progresses towards its expected value in 2035, the regional variations underline the critical dynamics and trends shaping the industry, revealing valuable insights into market segmentation and its potential growth drivers across different areas.

Source: Primary Research, Secondary Research, MRFR Database and Analyst Review
Spark Plug Market Key Players and Competitive Insights:
The Spark Plug Market is characterized by intense competition among various manufacturers who are striving to enhance their product offerings and expand their market share. In this rapidly evolving landscape, companies are focusing on technological advancements, innovative designs, and materials that improve overall performance. With the increasing demand for efficient and durable spark plugs driven by the growing automotive industry, manufacturers are investing heavily in research and development, aimed at creating products that meet specific requirements for numerous vehicle types.
This competitive environment is further complicated by factors such as the growing emphasis on environmentally friendly products and compliance with stringent emissions regulations, compelling manufacturers to adapt their strategies accordingly. The interplay between established firms and emerging players highlights a dynamic market where adaptability and innovation become key differentiators.
Magneti Marelli has consistently maintained a significant presence in the Spark Plug Market, recognized for its high-quality automotive components. The company is renowned for its extensive range of spark plugs, which are designed to meet a variety of customer needs and enhance engine efficiency. Magneti Marelli's strengths lie in its robust technology and manufacturing capabilities, enabling it to deliver reliable and high-performance products.
Additionally, the company's strong relationships with major automotive manufacturers provide it with a strategic advantage in terms of distribution and brand recognition. The company's commitment to innovation and responsiveness to market demands has solidified its reputation among both consumers and industry stakeholders, contributing to its prevailing position in the global marketplace.
FederalMogul represents another formidable player in the Spark Plug Market, characterized by its diverse product portfolio and global reach. The company offers a comprehensive range of spark plugs tailored for various automotive applications, emphasizing performance, durability, and fuel efficiency. FederalMogul's robust market presence is supported by its extensive distribution networks and reliable customer service strategies. The company is noted for its ongoing investments in research and development, focusing on innovative solutions that meet the evolving needs of the automotive sector.
Recent mergers and acquisitions have further strengthened FederalMogul's capabilities and market positioning, allowing the company to enhance its product offerings while maintaining competitive pricing. With a continued focus on technological advancements and superior customer relations, FederalMogul remains a key influencer in the global spark plug landscape.
Key Companies in the Spark Plug Market Include:
- Magneti Marelli
- FederalMogul
- E3 Spark Plugs
- Autolite
- AC Delco
- Denso Corporation
- Valeo
- NGK Spark Plug
- Brisk
- Motorcraft
- Bosch
- Tenneco
- Champion
Spark Plug Market Industry Developments
Recent developments in the Spark Plug Market have seen increased attention from key players. Companies such as Denso Corporation and NGK Spark Plug have been focusing on Research and Development to enhance product efficiency, driven by the growing demand for fuel-efficient vehicles and the shift toward electric vehicles. In September 2023, Magneti Marelli made headlines with a significant investment in advanced spark plug technology aimed at reducing emissions in gasoline engines. Furthermore, AC Delco and Autolite are showing strong growth trajectories within the aftermarket segment, reflecting consumer preferences for reliable brands.
In terms of mergers and acquisitions, Champion expanded its market reach in June 2023 through the acquisition of Irfan International, aiming to strengthen its footprint in the Asian market. Notably, Bosch announced a strategic partnership with Tenneco to collaborate on spark plug innovations that promote sustainability. The valuation of companies like FederalMogul and Brisk has increased due to heightened consumer demand, contributing to a competitive landscape that emphasizes innovation and efficiency. Over the last two years, the market has been influenced by advancements in materials technology, with several companies investing in new alloys for improved performance.
Report Attribute/Metric |
Details |
Market Size 2023 |
4.07(USD Billion) |
Market Size 2024 |
4.14(USD Billion) |
Market Size 2035 |
5.0(USD Billion) |
Compound Annual Growth Rate (CAGR) |
1.73% (2025 - 2035) |
Report Coverage |
Revenue Forecast, Competitive Landscape, Growth Factors, and Trends |
Base Year |
2024 |
Market Forecast Period |
2025 - 2035 |
Historical Data |
2019 - 2024 |
Market Forecast Units |
USD Billion |
Key Companies Profiled |
Magneti Marelli, FederalMogul, E3 Spark Plugs, Autolite, AC Delco, Denso Corporation, Valeo, NGK Spark Plug, Brisk, Motorcraft, Bosch, Tenneco, Champion |
Segments Covered |
Type, Application, End Use, Fuel Type, Regional |
Key Market Opportunities |
Rising automotive production, Shift to electric vehicles, Increased demand for fuel efficiency, Growth in aftermarket services, Advancements in spark plug technology |
Key Market Dynamics |
increasing vehicle production, growing demand for fuel efficiency, rise in automotive aftermarket, technological advancements in spark plugs, stringent emission regulations |
Countries Covered |
North America, Europe, APAC, South America, MEA |
Spark Plugs Market Highlights:
Frequently Asked Questions (FAQ) :
The Spark Plug Market is expected to be valued at 4.14 USD Billion in 2024.
By 2035, the Spark Plug Market is projected to be valued at 5.0 USD Billion.
The expected compound annual growth rate (CAGR) for the Spark Plug Market from 2025 to 2035 is 1.73 percent.
By 2035, the Asia Pacific region is expected to hold the largest market share, valued at 1.862 USD Billion.
In 2035, the market size for Iridium spark plugs is expected to reach 1.6 USD Billion.
Major players in the Spark Plug Market include NGK Spark Plug, Denso Corporation, and Bosch, among others.
The North American spark plug market is expected to grow to 1.152 USD Billion by 2035.
In 2024, the market size for Platinum spark plugs is expected to be valued at 1.2 USD Billion.
Challenges in the Spark Plug Market include the rising competition and fluctuating raw material prices.
By 2035, the market size for Double Platinum spark plugs is projected to reach 0.7 USD Billion.
TABLE OF CONTENTS
1. EXECUTIVE SUMMARY
1.1. Market Overview
1.2. Key Findings
1.3. Market Segmentation
1.4. Competitive Landscape
1.5. Challenges and Opportunities
1.6. Future Outlook
2. MARKET INTRODUCTION
2.1. Definition
2.2. Scope of the study
2.2.1. Research Objective
2.2.2. Assumption
2.2.3. Limitations
3. RESEARCH METHODOLOGY
3.1. Overview
3.2. Data Mining
3.3. Secondary Research
3.4. Primary Research
3.4.1. Primary Interviews and Information Gathering Process
3.4.2. Breakdown of Primary Respondents
3.5. Forecasting Model
3.6. Market Size Estimation
3.6.1. Bottom-Up Approach
3.6.2. Top-Down Approach
3.7. Data Triangulation
3.8. Validation
4. MARKET DYNAMICS
4.1. Overview
4.2. Drivers
4.3. Restraints
4.4. Opportunities
5. MARKET FACTOR ANALYSIS
5.1. Value chain Analysis
5.2. Porter's Five Forces Analysis
5.2.1. Bargaining Power of Suppliers
5.2.2. Bargaining Power of Buyers
5.2.3. Threat of New Entrants
5.2.4. Threat of Substitutes
5.2.5. Intensity of Rivalry
5.3. COVID-19 Impact Analysis
5.3.1. Market Impact Analysis
5.3.2. Regional Impact
5.3.3. Opportunity and Threat Analysis
6. SPARK PLUG MARKET, BY TYPE (USD BILLION)
6.1. Copper
6.2. Platinum
6.3. Iridium
6.4. Double Platinum
7. SPARK PLUG MARKET, BY APPLICATION (USD BILLION)
7.1. Automotive
7.2. Motorcycle
7.3. Small Engine
7.4. Marine
8. SPARK PLUG MARKET, BY END USE (USD BILLION)
8.1. OEM
8.2. Aftermarket
9. SPARK PLUG MARKET, BY FUEL TYPE (USD BILLION)
9.1. Gasoline
9.2. Diesel
9.3. Ethanol
9.4. LPG
10. SPARK PLUG MARKET, BY REGIONAL (USD BILLION)
10.1. North America
10.1.1. US
10.1.2. Canada
10.2. Europe
10.2.1. Germany
10.2.2. UK
10.2.3. France
10.2.4. Russia
10.2.5. Italy
10.2.6. Spain
10.2.7. Rest of Europe
10.3. APAC
10.3.1. China
10.3.2. India
10.3.3. Japan
10.3.4. South Korea
10.3.5. Malaysia
10.3.6. Thailand
10.3.7. Indonesia
10.3.8. Rest of APAC
10.4. South America
10.4.1. Brazil
10.4.2. Mexico
10.4.3. Argentina
10.4.4. Rest of South America
10.5. MEA
10.5.1. GCC Countries
10.5.2. South Africa
10.5.3. Rest of MEA
11. COMPETITIVE LANDSCAPE
11.1. Overview
11.2. Competitive Analysis
11.3. Market share Analysis
11.4. Major Growth Strategy in the Spark Plug Market
11.5. Competitive Benchmarking
11.6. Leading Players in Terms of Number of Developments in the Spark Plug Market
11.7. Key developments and growth strategies
11.7.1. New Product Launch/Service Deployment
11.7.2. Merger & Acquisitions
11.7.3. Joint Ventures
11.8. Major Players Financial Matrix
11.8.1. Sales and Operating Income
11.8.2. Major Players R&D Expenditure. 2023
12. COMPANY PROFILES
12.1. Magneti Marelli
12.1.1. Financial Overview
12.1.2. Products Offered
12.1.3. Key Developments
12.1.4. SWOT Analysis
12.1.5. Key Strategies
12.2. FederalMogul
12.2.1. Financial Overview
12.2.2. Products Offered
12.2.3. Key Developments
12.2.4. SWOT Analysis
12.2.5. Key Strategies
12.3. E3 Spark Plugs
12.3.1. Financial Overview
12.3.2. Products Offered
12.3.3. Key Developments
12.3.4. SWOT Analysis
12.3.5. Key Strategies
12.4. Spark Plug Manufacturing
12.4.1. Financial Overview
12.4.2. Products Offered
12.4.3. Key Developments
12.4.4. SWOT Analysis
12.4.5. Key Strategies
12.5. Autolite
12.5.1. Financial Overview
12.5.2. Products Offered
12.5.3. Key Developments
12.5.4. SWOT Analysis
12.5.5. Key Strategies
12.6. AC Delco
12.6.1. Financial Overview
12.6.2. Products Offered
12.6.3. Key Developments
12.6.4. SWOT Analysis
12.6.5. Key Strategies
12.7. Irfan International
12.7.1. Financial Overview
12.7.2. Products Offered
12.7.3. Key Developments
12.7.4. SWOT Analysis
12.7.5. Key Strategies
12.8. Denso Corporation
12.8.1. Financial Overview
12.8.2. Products Offered
12.8.3. Key Developments
12.8.4. SWOT Analysis
12.8.5. Key Strategies
12.9. Valeo
12.9.1. Financial Overview
12.9.2. Products Offered
12.9.3. Key Developments
12.9.4. SWOT Analysis
12.9.5. Key Strategies
12.10. NGK Spark Plug
12.10.1. Financial Overview
12.10.2. Products Offered
12.10.3. Key Developments
12.10.4. SWOT Analysis
12.10.5. Key Strategies
12.11. Brisk
12.11.1. Financial Overview
12.11.2. Products Offered
12.11.3. Key Developments
12.11.4. SWOT Analysis
12.11.5. Key Strategies
12.12. Motorcraft
12.12.1. Financial Overview
12.12.2. Products Offered
12.12.3. Key Developments
12.12.4. SWOT Analysis
12.12.5. Key Strategies
12.13. Bosch
12.13.1. Financial Overview
12.13.2. Products Offered
12.13.3. Key Developments
12.13.4. SWOT Analysis
12.13.5. Key Strategies
12.14. Tenneco
12.14.1. Financial Overview
12.14.2. Products Offered
12.14.3. Key Developments
12.14.4. SWOT Analysis
12.14.5. Key Strategies
12.15. Champion
12.15.1. Financial Overview
12.15.2. Products Offered
12.15.3. Key Developments
12.15.4. SWOT Analysis
12.15.5. Key Strategies
13. APPENDIX
13.1. References
13.2. Related Reports
LIST OF TABLES
TABLE 1. LIST OF ASSUMPTIONS
TABLE 2. NORTH AMERICA MARKET SIZE ESTIMATES & FORECAST, BY TYPE, 2019-2035 (USD BILLIONS) TABLE 3. NORTH AMERICA MARKET SIZE ESTIMATES & FORECAST, BY APPLICATION, 2019-2035 (USD BILLIONS) TABLE 4. NORTH AMERICA MARKET SIZE ESTIMATES & FORECAST, BY END USE, 2019-2035 (USD BILLIONS) TABLE 5. NORTH AMERICA MARKET SIZE ESTIMATES & FORECAST, BY FUEL TYPE, 2019-2035 (USD BILLIONS) TABLE 6. NORTH AMERICA MARKET SIZE ESTIMATES & FORECAST, BY REGIONAL, 2019-2035 (USD BILLIONS) TABLE 7. US MARKET SIZE ESTIMATES & FORECAST, BY TYPE, 2019-2035 (USD BILLIONS) TABLE 8. US MARKET SIZE ESTIMATES & FORECAST, BY APPLICATION, 2019-2035 (USD BILLIONS) TABLE 9. US MARKET SIZE ESTIMATES & FORECAST, BY END USE, 2019-2035 (USD BILLIONS) TABLE 10. US MARKET SIZE ESTIMATES & FORECAST, BY FUEL TYPE, 2019-2035 (USD BILLIONS) TABLE 11. US MARKET SIZE ESTIMATES & FORECAST, BY REGIONAL, 2019-2035 (USD BILLIONS) TABLE 12. CANADA MARKET SIZE ESTIMATES & FORECAST, BY TYPE, 2019-2035 (USD BILLIONS) TABLE 13. CANADA MARKET SIZE ESTIMATES & FORECAST, BY APPLICATION, 2019-2035 (USD BILLIONS) TABLE 14. CANADA MARKET SIZE ESTIMATES & FORECAST, BY END USE, 2019-2035 (USD BILLIONS) TABLE 15. CANADA MARKET SIZE ESTIMATES & FORECAST, BY FUEL TYPE, 2019-2035 (USD BILLIONS) TABLE 16. CANADA MARKET SIZE ESTIMATES & FORECAST, BY REGIONAL, 2019-2035 (USD BILLIONS) TABLE 17. EUROPE MARKET SIZE ESTIMATES & FORECAST, BY TYPE, 2019-2035 (USD BILLIONS) TABLE 18. EUROPE MARKET SIZE ESTIMATES & FORECAST, BY APPLICATION, 2019-2035 (USD BILLIONS) TABLE 19. EUROPE MARKET SIZE ESTIMATES & FORECAST, BY END USE, 2019-2035 (USD BILLIONS) TABLE 20. EUROPE MARKET SIZE ESTIMATES & FORECAST, BY FUEL TYPE, 2019-2035 (USD BILLIONS) TABLE 21. EUROPE MARKET SIZE ESTIMATES & FORECAST, BY REGIONAL, 2019-2035 (USD BILLIONS) TABLE 22. GERMANY MARKET SIZE ESTIMATES & FORECAST, BY TYPE, 2019-2035 (USD BILLIONS) TABLE 23. GERMANY MARKET SIZE ESTIMATES & FORECAST, BY APPLICATION, 2019-2035 (USD BILLIONS) TABLE 24. GERMANY MARKET SIZE ESTIMATES & FORECAST, BY END USE, 2019-2035 (USD BILLIONS) TABLE 25. GERMANY MARKET SIZE ESTIMATES & FORECAST, BY FUEL TYPE, 2019-2035 (USD BILLIONS) TABLE 26. GERMANY MARKET SIZE ESTIMATES & FORECAST, BY REGIONAL, 2019-2035 (USD BILLIONS) TABLE 27. UK MARKET SIZE ESTIMATES & FORECAST, BY TYPE, 2019-2035 (USD BILLIONS) TABLE 28. UK MARKET SIZE ESTIMATES & FORECAST, BY APPLICATION, 2019-2035 (USD BILLIONS) TABLE 29. UK MARKET SIZE ESTIMATES & FORECAST, BY END USE, 2019-2035 (USD BILLIONS) TABLE 30. UK MARKET SIZE ESTIMATES & FORECAST, BY FUEL TYPE, 2019-2035 (USD BILLIONS) TABLE 31. UK MARKET SIZE ESTIMATES & FORECAST, BY REGIONAL, 2019-2035 (USD BILLIONS) TABLE 32. FRANCE MARKET SIZE ESTIMATES & FORECAST, BY TYPE, 2019-2035 (USD BILLIONS) TABLE 33. FRANCE MARKET SIZE ESTIMATES & FORECAST, BY APPLICATION, 2019-2035 (USD BILLIONS) TABLE 34. FRANCE MARKET SIZE ESTIMATES & FORECAST, BY END USE, 2019-2035 (USD BILLIONS) TABLE 35. FRANCE MARKET SIZE ESTIMATES & FORECAST, BY FUEL TYPE, 2019-2035 (USD BILLIONS) TABLE 36. FRANCE MARKET SIZE ESTIMATES & FORECAST, BY REGIONAL, 2019-2035 (USD BILLIONS) TABLE 37. RUSSIA MARKET SIZE ESTIMATES & FORECAST, BY TYPE, 2019-2035 (USD BILLIONS) TABLE 38. RUSSIA MARKET SIZE ESTIMATES & FORECAST, BY APPLICATION, 2019-2035 (USD BILLIONS) TABLE 39. RUSSIA MARKET SIZE ESTIMATES & FORECAST, BY END USE, 2019-2035 (USD BILLIONS) TABLE 40. RUSSIA MARKET SIZE ESTIMATES & FORECAST, BY FUEL TYPE, 2019-2035 (USD BILLIONS) TABLE 41. RUSSIA MARKET SIZE ESTIMATES & FORECAST, BY REGIONAL, 2019-2035 (USD BILLIONS) TABLE 42. ITALY MARKET SIZE ESTIMATES & FORECAST, BY TYPE, 2019-2035 (USD BILLIONS) TABLE 43. ITALY MARKET SIZE ESTIMATES & FORECAST, BY APPLICATION, 2019-2035 (USD BILLIONS) TABLE 44. ITALY MARKET SIZE ESTIMATES & FORECAST, BY END USE, 2019-2035 (USD BILLIONS) TABLE 45. ITALY MARKET SIZE ESTIMATES & FORECAST, BY FUEL TYPE, 2019-2035 (USD BILLIONS) TABLE 46. ITALY MARKET SIZE ESTIMATES & FORECAST, BY REGIONAL, 2019-2035 (USD BILLIONS) TABLE 47. SPAIN MARKET SIZE ESTIMATES & FORECAST, BY TYPE, 2019-2035 (USD BILLIONS) TABLE 48. SPAIN MARKET SIZE ESTIMATES & FORECAST, BY APPLICATION, 2019-2035 (USD BILLIONS) TABLE 49. SPAIN MARKET SIZE ESTIMATES & FORECAST, BY END USE, 2019-2035 (USD BILLIONS) TABLE 50. SPAIN MARKET SIZE ESTIMATES & FORECAST, BY FUEL TYPE, 2019-2035 (USD BILLIONS) TABLE 51. SPAIN MARKET SIZE ESTIMATES & FORECAST, BY REGIONAL, 2019-2035 (USD BILLIONS) TABLE 52. REST OF EUROPE MARKET SIZE ESTIMATES & FORECAST, BY TYPE, 2019-2035 (USD BILLIONS) TABLE 53. REST OF EUROPE MARKET SIZE ESTIMATES & FORECAST, BY APPLICATION, 2019-2035 (USD BILLIONS) TABLE 54. REST OF EUROPE MARKET SIZE ESTIMATES & FORECAST, BY END USE, 2019-2035 (USD BILLIONS) TABLE 55. REST OF EUROPE MARKET SIZE ESTIMATES & FORECAST, BY FUEL TYPE, 2019-2035 (USD BILLIONS) TABLE 56. REST OF EUROPE MARKET SIZE ESTIMATES & FORECAST, BY REGIONAL, 2019-2035 (USD BILLIONS) TABLE 57. APAC MARKET SIZE ESTIMATES & FORECAST, BY TYPE, 2019-2035 (USD BILLIONS) TABLE 58. APAC MARKET SIZE ESTIMATES & FORECAST, BY APPLICATION, 2019-2035 (USD BILLIONS) TABLE 59. APAC MARKET SIZE ESTIMATES & FORECAST, BY END USE, 2019-2035 (USD BILLIONS) TABLE 60. APAC MARKET SIZE ESTIMATES & FORECAST, BY FUEL TYPE, 2019-2035 (USD BILLIONS) TABLE 61. APAC MARKET SIZE ESTIMATES & FORECAST, BY REGIONAL, 2019-2035 (USD BILLIONS) TABLE 62. CHINA MARKET SIZE ESTIMATES & FORECAST, BY TYPE, 2019-2035 (USD BILLIONS) TABLE 63. CHINA MARKET SIZE ESTIMATES & FORECAST, BY APPLICATION, 2019-2035 (USD BILLIONS) TABLE 64. CHINA MARKET SIZE ESTIMATES & FORECAST, BY END USE, 2019-2035 (USD BILLIONS) TABLE 65. CHINA MARKET SIZE ESTIMATES & FORECAST, BY FUEL TYPE, 2019-2035 (USD BILLIONS) TABLE 66. CHINA MARKET SIZE ESTIMATES & FORECAST, BY REGIONAL, 2019-2035 (USD BILLIONS) TABLE 67. INDIA MARKET SIZE ESTIMATES & FORECAST, BY TYPE, 2019-2035 (USD BILLIONS) TABLE 68. INDIA MARKET SIZE ESTIMATES & FORECAST, BY APPLICATION, 2019-2035 (USD BILLIONS) TABLE 69. INDIA MARKET SIZE ESTIMATES & FORECAST, BY END USE, 2019-2035 (USD BILLIONS) TABLE 70. INDIA MARKET SIZE ESTIMATES & FORECAST, BY FUEL TYPE, 2019-2035 (USD BILLIONS) TABLE 71. INDIA MARKET SIZE ESTIMATES & FORECAST, BY REGIONAL, 2019-2035 (USD BILLIONS) TABLE 72. JAPAN MARKET SIZE ESTIMATES & FORECAST, BY TYPE, 2019-2035 (USD BILLIONS) TABLE 73. JAPAN MARKET SIZE ESTIMATES & FORECAST, BY APPLICATION, 2019-2035 (USD BILLIONS) TABLE 74. JAPAN MARKET SIZE ESTIMATES & FORECAST, BY END USE, 2019-2035 (USD BILLIONS) TABLE 75. JAPAN MARKET SIZE ESTIMATES & FORECAST, BY FUEL TYPE, 2019-2035 (USD BILLIONS) TABLE 76. JAPAN MARKET SIZE ESTIMATES & FORECAST, BY REGIONAL, 2019-2035 (USD BILLIONS) TABLE 77. SOUTH KOREA MARKET SIZE ESTIMATES & FORECAST, BY TYPE, 2019-2035 (USD BILLIONS) TABLE 78. SOUTH KOREA MARKET SIZE ESTIMATES & FORECAST, BY APPLICATION, 2019-2035 (USD BILLIONS) TABLE 79. SOUTH KOREA MARKET SIZE ESTIMATES & FORECAST, BY END USE, 2019-2035 (USD BILLIONS) TABLE 80. SOUTH KOREA MARKET SIZE ESTIMATES & FORECAST, BY FUEL TYPE, 2019-2035 (USD BILLIONS) TABLE 81. SOUTH KOREA MARKET SIZE ESTIMATES & FORECAST, BY REGIONAL, 2019-2035 (USD BILLIONS) TABLE 82. MALAYSIA MARKET SIZE ESTIMATES & FORECAST, BY TYPE, 2019-2035 (USD BILLIONS) TABLE 83. MALAYSIA MARKET SIZE ESTIMATES & FORECAST, BY APPLICATION, 2019-2035 (USD BILLIONS) TABLE 84. MALAYSIA MARKET SIZE ESTIMATES & FORECAST, BY END USE, 2019-2035 (USD BILLIONS) TABLE 85. MALAYSIA MARKET SIZE ESTIMATES & FORECAST, BY FUEL TYPE, 2019-2035 (USD BILLIONS) TABLE 86. MALAYSIA MARKET SIZE ESTIMATES & FORECAST, BY REGIONAL, 2019-2035 (USD BILLIONS) TABLE 87. THAILAND MARKET SIZE ESTIMATES & FORECAST, BY TYPE, 2019-2035 (USD BILLIONS) TABLE 88. THAILAND MARKET SIZE ESTIMATES & FORECAST, BY APPLICATION, 2019-2035 (USD BILLIONS) TABLE 89. THAILAND MARKET SIZE ESTIMATES & FORECAST, BY END USE, 2019-2035 (USD BILLIONS) TABLE 90. THAILAND MARKET SIZE ESTIMATES & FORECAST, BY FUEL TYPE, 2019-2035 (USD BILLIONS) TABLE 91. THAILAND MARKET SIZE ESTIMATES & FORECAST, BY REGIONAL, 2019-2035 (USD BILLIONS) TABLE 92. INDONESIA MARKET SIZE ESTIMATES & FORECAST, BY TYPE, 2019-2035 (USD BILLIONS) TABLE 93. INDONESIA MARKET SIZE ESTIMATES & FORECAST, BY APPLICATION, 2019-2035 (USD BILLIONS) TABLE 94. INDONESIA MARKET SIZE ESTIMATES & FORECAST, BY END USE, 2019-2035 (USD BILLIONS) TABLE 95. INDONESIA MARKET SIZE ESTIMATES & FORECAST, BY FUEL TYPE, 2019-2035 (USD BILLIONS) TABLE 96. INDONESIA MARKET SIZE ESTIMATES & FORECAST, BY REGIONAL, 2019-2035 (USD BILLIONS) TABLE 97. REST OF APAC MARKET SIZE ESTIMATES & FORECAST, BY TYPE, 2019-2035 (USD BILLIONS) TABLE 98. REST OF APAC MARKET SIZE ESTIMATES & FORECAST, BY APPLICATION, 2019-2035 (USD BILLIONS) TABLE 99. REST OF APAC MARKET SIZE ESTIMATES & FORECAST, BY END USE, 2019-2035 (USD BILLIONS) TABLE 100. REST OF APAC MARKET SIZE ESTIMATES & FORECAST, BY FUEL TYPE, 2019-2035 (USD BILLIONS) TABLE 101. REST OF APAC MARKET SIZE ESTIMATES & FORECAST, BY REGIONAL, 2019-2035 (USD BILLIONS) TABLE 102. SOUTH AMERICA MARKET SIZE ESTIMATES & FORECAST, BY TYPE, 2019-2035 (USD BILLIONS) TABLE 103. SOUTH AMERICA MARKET SIZE ESTIMATES & FORECAST, BY APPLICATION, 2019-2035 (USD BILLIONS) TABLE 104. SOUTH AMERICA MARKET SIZE ESTIMATES & FORECAST, BY END USE, 2019-2035 (USD BILLIONS) TABLE 105. SOUTH AMERICA MARKET SIZE ESTIMATES & FORECAST, BY FUEL TYPE, 2019-2035 (USD BILLIONS) TABLE 106. SOUTH AMERICA MARKET SIZE ESTIMATES & FORECAST, BY REGIONAL, 2019-2035 (USD BILLIONS) TABLE 107. BRAZIL MARKET SIZE ESTIMATES & FORECAST, BY TYPE, 2019-2035 (USD BILLIONS) TABLE 108. BRAZIL MARKET SIZE ESTIMATES & FORECAST, BY APPLICATION, 2019-2035 (USD BILLIONS) TABLE 109. BRAZIL MARKET SIZE ESTIMATES & FORECAST, BY END USE, 2019-2035 (USD BILLIONS) TABLE 110. BRAZIL MARKET SIZE ESTIMATES & FORECAST, BY FUEL TYPE, 2019-2035 (USD BILLIONS) TABLE 111. BRAZIL MARKET SIZE ESTIMATES & FORECAST, BY REGIONAL, 2019-2035 (USD BILLIONS) TABLE 112. MEXICO MARKET SIZE ESTIMATES & FORECAST, BY TYPE, 2019-2035 (USD BILLIONS) TABLE 113. MEXICO MARKET SIZE ESTIMATES & FORECAST, BY APPLICATION, 2019-2035 (USD BILLIONS) TABLE 114. MEXICO MARKET SIZE ESTIMATES & FORECAST, BY END USE, 2019-2035 (USD BILLIONS) TABLE 115. MEXICO MARKET SIZE ESTIMATES & FORECAST, BY FUEL TYPE, 2019-2035 (USD BILLIONS) TABLE 116. MEXICO MARKET SIZE ESTIMATES & FORECAST, BY REGIONAL, 2019-2035 (USD BILLIONS) TABLE 117. ARGENTINA MARKET SIZE ESTIMATES & FORECAST, BY TYPE, 2019-2035 (USD BILLIONS) TABLE 118. ARGENTINA MARKET SIZE ESTIMATES & FORECAST, BY APPLICATION, 2019-2035 (USD BILLIONS) TABLE 119. ARGENTINA MARKET SIZE ESTIMATES & FORECAST, BY END USE, 2019-2035 (USD BILLIONS) TABLE 120. ARGENTINA MARKET SIZE ESTIMATES & FORECAST, BY FUEL TYPE, 2019-2035 (USD BILLIONS) TABLE 121. ARGENTINA MARKET SIZE ESTIMATES & FORECAST, BY REGIONAL, 2019-2035 (USD BILLIONS) TABLE 122. REST OF SOUTH AMERICA MARKET SIZE ESTIMATES & FORECAST, BY TYPE, 2019-2035 (USD BILLIONS) TABLE 123. REST OF SOUTH AMERICA MARKET SIZE ESTIMATES & FORECAST, BY APPLICATION, 2019-2035 (USD BILLIONS) TABLE 124. REST OF SOUTH AMERICA MARKET SIZE ESTIMATES & FORECAST, BY END USE, 2019-2035 (USD BILLIONS) TABLE 125. REST OF SOUTH AMERICA MARKET SIZE ESTIMATES & FORECAST, BY FUEL TYPE, 2019-2035 (USD BILLIONS) TABLE 126. REST OF SOUTH AMERICA MARKET SIZE ESTIMATES & FORECAST, BY REGIONAL, 2019-2035 (USD BILLIONS) TABLE 127. MEA MARKET SIZE ESTIMATES & FORECAST, BY TYPE, 2019-2035 (USD BILLIONS) TABLE 128. MEA MARKET SIZE ESTIMATES & FORECAST, BY APPLICATION, 2019-2035 (USD BILLIONS) TABLE 129. MEA MARKET SIZE ESTIMATES & FORECAST, BY END USE, 2019-2035 (USD BILLIONS) TABLE 130. MEA MARKET SIZE ESTIMATES & FORECAST, BY FUEL TYPE, 2019-2035 (USD BILLIONS) TABLE 131. MEA MARKET SIZE ESTIMATES & FORECAST, BY REGIONAL, 2019-2035 (USD BILLIONS) TABLE 132. GCC COUNTRIES MARKET SIZE ESTIMATES & FORECAST, BY TYPE, 2019-2035 (USD BILLIONS) TABLE 133. GCC COUNTRIES MARKET SIZE ESTIMATES & FORECAST, BY APPLICATION, 2019-2035 (USD BILLIONS) TABLE 134. GCC COUNTRIES MARKET SIZE ESTIMATES & FORECAST, BY END USE, 2019-2035 (USD BILLIONS) TABLE 135. GCC COUNTRIES MARKET SIZE ESTIMATES & FORECAST, BY FUEL TYPE, 2019-2035 (USD BILLIONS) TABLE 136. GCC COUNTRIES MARKET SIZE ESTIMATES & FORECAST, BY REGIONAL, 2019-2035 (USD BILLIONS) TABLE 137. SOUTH AFRICA MARKET SIZE ESTIMATES & FORECAST, BY TYPE, 2019-2035 (USD BILLIONS) TABLE 138. SOUTH AFRICA MARKET SIZE ESTIMATES & FORECAST, BY APPLICATION, 2019-2035 (USD BILLIONS) TABLE 139. SOUTH AFRICA MARKET SIZE ESTIMATES & FORECAST, BY END USE, 2019-2035 (USD BILLIONS) TABLE 140. SOUTH AFRICA MARKET SIZE ESTIMATES & FORECAST, BY FUEL TYPE, 2019-2035 (USD BILLIONS) TABLE 141. SOUTH AFRICA MARKET SIZE ESTIMATES & FORECAST, BY REGIONAL, 2019-2035 (USD BILLIONS) TABLE 142. REST OF MEA MARKET SIZE ESTIMATES & FORECAST, BY TYPE, 2019-2035 (USD BILLIONS) TABLE 143. REST OF MEA MARKET SIZE ESTIMATES & FORECAST, BY APPLICATION, 2019-2035 (USD BILLIONS) TABLE 144. REST OF MEA MARKET SIZE ESTIMATES & FORECAST, BY END USE, 2019-2035 (USD BILLIONS) TABLE 145. REST OF MEA MARKET SIZE ESTIMATES & FORECAST, BY FUEL TYPE, 2019-2035 (USD BILLIONS) TABLE 146. REST OF MEA MARKET SIZE ESTIMATES & FORECAST, BY REGIONAL, 2019-2035 (USD BILLIONS) TABLE 147. PRODUCT LAUNCH/PRODUCT DEVELOPMENT/APPROVAL TABLE 148. ACQUISITION/PARTNERSHIP
LIST OF FIGURES
FIGURE 1. MARKET SYNOPSIS FIGURE 2. NORTH AMERICA SPARK PLUG MARKET ANALYSIS FIGURE 3. US MARKET ANALYSIS BY TYPE FIGURE 4. US MARKET ANALYSIS BY APPLICATION FIGURE 5. US MARKET ANALYSIS BY END USE FIGURE 6. US MARKET ANALYSIS BY FUEL TYPE FIGURE 7. US MARKET ANALYSIS BY REGIONAL FIGURE 8. CANADA MARKET ANALYSIS BY TYPE FIGURE 9. CANADA MARKET ANALYSIS BY APPLICATION FIGURE 10. CANADA MARKET ANALYSIS BY END USE FIGURE 11. CANADA MARKET ANALYSIS BY FUEL TYPE FIGURE 12. CANADA MARKET ANALYSIS BY REGIONAL FIGURE 13. EUROPE SPARK PLUG MARKET ANALYSIS FIGURE 14. GERMANY MARKET ANALYSIS BY TYPE FIGURE 15. GERMANY MARKET ANALYSIS BY APPLICATION FIGURE 16. GERMANY MARKET ANALYSIS BY END USE FIGURE 17. GERMANY MARKET ANALYSIS BY FUEL TYPE FIGURE 18. GERMANY MARKET ANALYSIS BY REGIONAL FIGURE 19. UK MARKET ANALYSIS BY TYPE FIGURE 20. UK MARKET ANALYSIS BY APPLICATION FIGURE 21. UK MARKET ANALYSIS BY END USE FIGURE 22. UK MARKET ANALYSIS BY FUEL TYPE FIGURE 23. UK MARKET ANALYSIS BY REGIONAL FIGURE 24. FRANCE MARKET ANALYSIS BY TYPE FIGURE 25. FRANCE MARKET ANALYSIS BY APPLICATION FIGURE 26. FRANCE MARKET ANALYSIS BY END USE FIGURE 27. FRANCE MARKET ANALYSIS BY FUEL TYPE FIGURE 28. FRANCE MARKET ANALYSIS BY REGIONAL FIGURE 29. RUSSIA MARKET ANALYSIS BY TYPE FIGURE 30. RUSSIA MARKET ANALYSIS BY APPLICATION FIGURE 31. RUSSIA MARKET ANALYSIS BY END USE FIGURE 32. RUSSIA MARKET ANALYSIS BY FUEL TYPE FIGURE 33. RUSSIA MARKET ANALYSIS BY REGIONAL FIGURE 34. ITALY MARKET ANALYSIS BY TYPE FIGURE 35. ITALY MARKET ANALYSIS BY APPLICATION FIGURE 36. ITALY MARKET ANALYSIS BY END USE FIGURE 37. ITALY MARKET ANALYSIS BY FUEL TYPE FIGURE 38. ITALY MARKET ANALYSIS BY REGIONAL FIGURE 39. SPAIN MARKET ANALYSIS BY TYPE FIGURE 40. SPAIN MARKET ANALYSIS BY APPLICATION FIGURE 41. SPAIN MARKET ANALYSIS BY END USE FIGURE 42. SPAIN MARKET ANALYSIS BY FUEL TYPE FIGURE 43. SPAIN MARKET ANALYSIS BY REGIONAL FIGURE 44. REST OF EUROPE MARKET ANALYSIS BY TYPE FIGURE 45. REST OF EUROPE MARKET ANALYSIS BY APPLICATION FIGURE 46. REST OF EUROPE MARKET ANALYSIS BY END USE FIGURE 47. REST OF EUROPE MARKET ANALYSIS BY FUEL TYPE FIGURE 48. REST OF EUROPE MARKET ANALYSIS BY REGIONAL FIGURE 49. APAC SPARK PLUG MARKET ANALYSIS FIGURE 50. CHINA MARKET ANALYSIS BY TYPE FIGURE 51. CHINA MARKET ANALYSIS BY APPLICATION FIGURE 52. CHINA MARKET ANALYSIS BY END USE FIGURE 53. CHINA MARKET ANALYSIS BY FUEL TYPE FIGURE 54. CHINA MARKET ANALYSIS BY REGIONAL FIGURE 55. INDIA MARKET ANALYSIS BY TYPE FIGURE 56. INDIA MARKET ANALYSIS BY APPLICATION FIGURE 57. INDIA MARKET ANALYSIS BY END USE FIGURE 58. INDIA MARKET ANALYSIS BY FUEL TYPE FIGURE 59. INDIA MARKET ANALYSIS BY REGIONAL FIGURE 60. JAPAN MARKET ANALYSIS BY TYPE FIGURE 61. JAPAN MARKET ANALYSIS BY APPLICATION FIGURE 62. JAPAN MARKET ANALYSIS BY END USE FIGURE 63. JAPAN MARKET ANALYSIS BY FUEL TYPE FIGURE 64. JAPAN MARKET ANALYSIS BY REGIONAL FIGURE 65. SOUTH KOREA MARKET ANALYSIS BY TYPE FIGURE 66. SOUTH KOREA MARKET ANALYSIS BY APPLICATION FIGURE 67. SOUTH KOREA MARKET ANALYSIS BY END USE FIGURE 68. SOUTH KOREA MARKET ANALYSIS BY FUEL TYPE FIGURE 69. SOUTH KOREA MARKET ANALYSIS BY REGIONAL FIGURE 70. MALAYSIA MARKET ANALYSIS BY TYPE FIGURE 71. MALAYSIA MARKET ANALYSIS BY APPLICATION FIGURE 72. MALAYSIA MARKET ANALYSIS BY END USE FIGURE 73. MALAYSIA MARKET ANALYSIS BY FUEL TYPE FIGURE 74. MALAYSIA MARKET ANALYSIS BY REGIONAL FIGURE 75. THAILAND MARKET ANALYSIS BY TYPE FIGURE 76. THAILAND MARKET ANALYSIS BY APPLICATION FIGURE 77. THAILAND MARKET ANALYSIS BY END USE FIGURE 78. THAILAND MARKET ANALYSIS BY FUEL TYPE FIGURE 79. THAILAND MARKET ANALYSIS BY REGIONAL FIGURE 80. INDONESIA MARKET ANALYSIS BY TYPE FIGURE 81. INDONESIA MARKET ANALYSIS BY APPLICATION FIGURE 82. INDONESIA MARKET ANALYSIS BY END USE FIGURE 83. INDONESIA MARKET ANALYSIS BY FUEL TYPE FIGURE 84. INDONESIA MARKET ANALYSIS BY REGIONAL FIGURE 85. REST OF APAC MARKET ANALYSIS BY TYPE FIGURE 86. REST OF APAC MARKET ANALYSIS BY APPLICATION FIGURE 87. REST OF APAC MARKET ANALYSIS BY END USE FIGURE 88. REST OF APAC MARKET ANALYSIS BY FUEL TYPE FIGURE 89. REST OF APAC MARKET ANALYSIS BY REGIONAL FIGURE 90. SOUTH AMERICA SPARK PLUG MARKET ANALYSIS FIGURE 91. BRAZIL MARKET ANALYSIS BY TYPE FIGURE 92. BRAZIL MARKET ANALYSIS BY APPLICATION FIGURE 93. BRAZIL MARKET ANALYSIS BY END USE FIGURE 94. BRAZIL MARKET ANALYSIS BY FUEL TYPE FIGURE 95. BRAZIL MARKET ANALYSIS BY REGIONAL FIGURE 96. MEXICO MARKET ANALYSIS BY TYPE FIGURE 97. MEXICO MARKET ANALYSIS BY APPLICATION FIGURE 98. MEXICO MARKET ANALYSIS BY END USE FIGURE 99. MEXICO MARKET ANALYSIS BY FUEL TYPE FIGURE 100. MEXICO MARKET ANALYSIS BY REGIONAL FIGURE 101. ARGENTINA MARKET ANALYSIS BY TYPE FIGURE 102. ARGENTINA MARKET ANALYSIS BY APPLICATION FIGURE 103. ARGENTINA MARKET ANALYSIS BY END USE FIGURE 104. ARGENTINA MARKET ANALYSIS BY FUEL TYPE FIGURE 105. ARGENTINA MARKET ANALYSIS BY REGIONAL FIGURE 106. REST OF SOUTH AMERICA MARKET ANALYSIS BY TYPE FIGURE 107. REST OF SOUTH AMERICA MARKET ANALYSIS BY APPLICATION FIGURE 108. REST OF SOUTH AMERICA MARKET ANALYSIS BY END USE FIGURE 109. REST OF SOUTH AMERICA MARKET ANALYSIS BY FUEL TYPE FIGURE 110. REST OF SOUTH AMERICA MARKET ANALYSIS BY REGIONAL FIGURE 111. MEA SPARK PLUG MARKET ANALYSIS FIGURE 112. GCC COUNTRIES MARKET ANALYSIS BY TYPE FIGURE 113. GCC COUNTRIES MARKET ANALYSIS BY APPLICATION FIGURE 114. GCC COUNTRIES MARKET ANALYSIS BY END USE FIGURE 115. GCC COUNTRIES MARKET ANALYSIS BY FUEL TYPE FIGURE 116. GCC COUNTRIES MARKET ANALYSIS BY REGIONAL FIGURE 117. SOUTH AFRICA MARKET ANALYSIS BY TYPE FIGURE 118. SOUTH AFRICA MARKET ANALYSIS BY APPLICATION FIGURE 119. SOUTH AFRICA MARKET ANALYSIS BY END USE FIGURE 120. SOUTH AFRICA MARKET ANALYSIS BY FUEL TYPE FIGURE 121. SOUTH AFRICA MARKET ANALYSIS BY REGIONAL FIGURE 122. REST OF MEA MARKET ANALYSIS BY TYPE FIGURE 123. REST OF MEA MARKET ANALYSIS BY APPLICATION FIGURE 124. REST OF MEA MARKET ANALYSIS BY END USE FIGURE 125. REST OF MEA MARKET ANALYSIS BY FUEL TYPE FIGURE 126. REST OF MEA MARKET ANALYSIS BY REGIONAL
FIGURE 127. KEY BUYING CRITERIA OF SPARK PLUG MARKET
FIGURE 128. RESEARCH PROCESS OF MRFR
FIGURE 129. DRO ANALYSIS OF SPARK PLUG MARKET
FIGURE 130. DRIVERS IMPACT ANALYSIS: SPARK PLUG MARKET
FIGURE 131. RESTRAINTS IMPACT ANALYSIS: SPARK PLUG MARKET
FIGURE 132. SUPPLY / VALUE CHAIN: SPARK PLUG MARKET
FIGURE 133. SPARK PLUG MARKET, BY TYPE, 2025 (% SHARE)
FIGURE 134. SPARK PLUG MARKET, BY TYPE, 2019 TO 2035 (USD Billions)
FIGURE 135. SPARK PLUG MARKET, BY APPLICATION, 2025 (% SHARE)
FIGURE 136. SPARK PLUG MARKET, BY APPLICATION, 2019 TO 2035 (USD Billions)
FIGURE 137. SPARK PLUG MARKET, BY END USE, 2025 (% SHARE)
FIGURE 138. SPARK PLUG MARKET, BY END USE, 2019 TO 2035 (USD Billions)
FIGURE 139. SPARK PLUG MARKET, BY FUEL TYPE, 2025 (% SHARE)
FIGURE 140. SPARK PLUG MARKET, BY FUEL TYPE, 2019 TO 2035 (USD Billions)
FIGURE 141. SPARK PLUG MARKET, BY REGIONAL, 2025 (% SHARE)
FIGURE 142. SPARK PLUG MARKET, BY REGIONAL, 2019 TO 2035 (USD Billions)
FIGURE 143. BENCHMARKING OF MAJOR COMPETITORS