Request Free Sample ×

Kindly complete the form below to receive a free sample of this Report

* Please use a valid business email

Leading companies partner with us for data-driven Insights

clients tt-cursor
Hero Background

Spain Medical Robotics Market

ID: MRFR/HC/43025-HCR
200 Pages
Nidhi Mandole
Last Updated: April 06, 2026

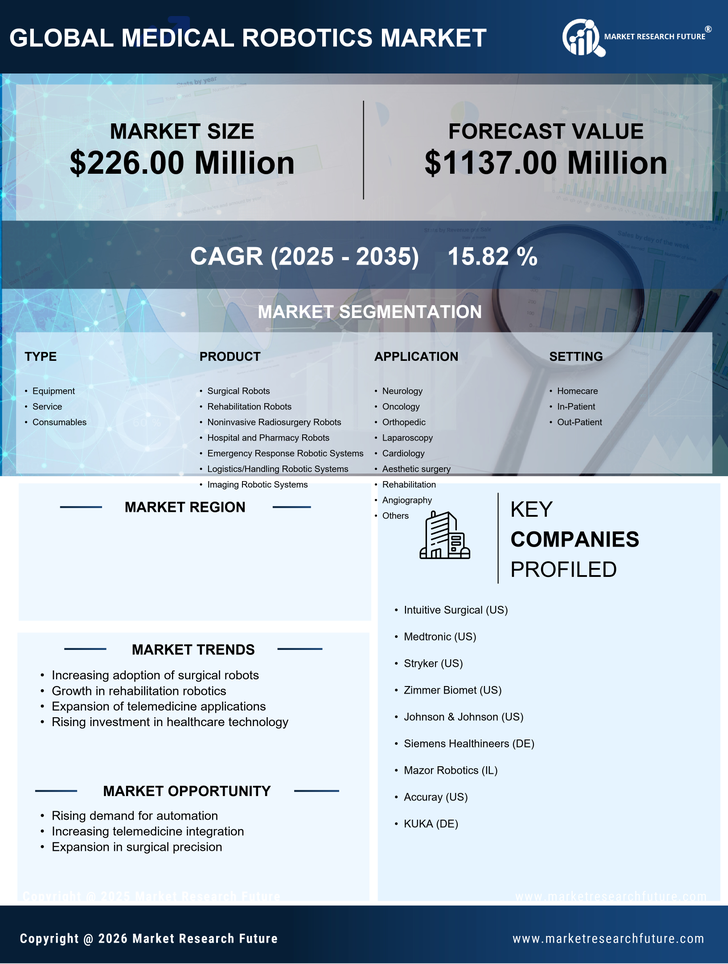
Spain Medical Robotics Market Research Report By Type (Equipment, Service, Consumables), By Product (Surgical Robots, Rehabilitation Robots, Noninvasive Radiosurgery Robots, Hospital and Pharmacy Robots, Emergency Response Robotic Systems, Logistics/Handling Robotic Systems, Imaging Robotic Systems), By Application (Neurology, Oncology, Orthopedic Robotic Systems, Laparoscopy, Cardiology, Aesthetic surgery, Rehabilitation, Angiography, Others), By Setting (Home-Care, In-Patient, Out-Patient) and By End User (Hospitals Clinics, Specialty Centers, Rehabilitation Centers, Others) - Growth & Industry Forecast 2025 To 2035

Share:
Download PDF ×

We do not share your information with anyone. However, we may send you emails based on your report interest from time to time. You may contact us at any time to opt-out.

Spain Medical Robotics Market Infographic
Purchase Options
  1. 1 SECTION I: EXECUTIVE SUMMARY AND KEY HIGHLIGHTS
  2.   1.1 EXECUTIVE SUMMARY
  3.     1.1.1 Market Overview
  4.     1.1.2 Key Findings
  5.     1.1.3 Market Segmentation
  6.     1.1.4 Competitive Landscape
  7.     1.1.5 Challenges and Opportunities
  8.     1.1.6 Future Outlook
  9. 2 SECTION II: SCOPING, METHODOLOGY AND MARKET STRUCTURE
  10.   2.1 MARKET INTRODUCTION
  11.     2.1.1 Definition
  12.     2.1.2 Scope of the study
  13.       2.1.2.1 Research Objective
  14.       2.1.2.2 Assumption
  15.       2.1.2.3 Limitations
  16.   2.2 RESEARCH METHODOLOGY
  17.     2.2.1 Overview
  18.     2.2.2 Data Mining
  19.     2.2.3 Secondary Research
  20.     2.2.4 Primary Research
  21.       2.2.4.1 Primary Interviews and Information Gathering Process
  22.       2.2.4.2 Breakdown of Primary Respondents
  23.     2.2.5 Forecasting Model
  24.     2.2.6 Market Size Estimation
  25.       2.2.6.1 Bottom-Up Approach
  26.       2.2.6.2 Top-Down Approach
  27.     2.2.7 Data Triangulation
  28.     2.2.8 Validation
  29. 3 SECTION III: QUALITATIVE ANALYSIS
  30.   3.1 MARKET DYNAMICS
  31.     3.1.1 Overview
  32.     3.1.2 Drivers
  33.     3.1.3 Restraints
  34.     3.1.4 Opportunities
  35.   3.2 MARKET FACTOR ANALYSIS
  36.     3.2.1 Value chain Analysis
  37.     3.2.2 Porter's Five Forces Analysis
  38.       3.2.2.1 Bargaining Power of Suppliers
  39.       3.2.2.2 Bargaining Power of Buyers
  40.       3.2.2.3 Threat of New Entrants
  41.       3.2.2.4 Threat of Substitutes
  42.       3.2.2.5 Intensity of Rivalry
  43.     3.2.3 COVID-19 Impact Analysis
  44.       3.2.3.1 Market Impact Analysis
  45.       3.2.3.2 Regional Impact
  46.       3.2.3.3 Opportunity and Threat Analysis
  47. 4 SECTION IV: QUANTITATIVE ANALYSIS
  48.   4.1 Chemicals and Materials, BY Type (USD Million)
  49.     4.1.1 Equipment
  50.     4.1.2 Service
  51.     4.1.3 Consumables
  52.   4.2 Chemicals and Materials, BY Product (USD Million)
  53.     4.2.1 Surgical Robots
  54.     4.2.2 Rehabilitation Robots
  55.     4.2.3 Noninvasive Radiosurgery Robots
  56.     4.2.4 Hospital and Pharmacy Robots
  57.     4.2.5 Emergency Response Robotic Systems
  58.     4.2.6 Logistics/Handling Robotic Systems
  59.     4.2.7 Imaging Robotic Systems
  60.   4.3 Chemicals and Materials, BY Application (USD Million)
  61.     4.3.1 Neurology
  62.     4.3.2 Oncology
  63.     4.3.3 Orthopedic
  64.     4.3.4 Laparoscopy
  65.     4.3.5 Cardiology
  66.     4.3.6 Aesthetic surgery
  67.     4.3.7 Rehabilitation
  68.     4.3.8 Angiography
  69.     4.3.9 Others
  70.   4.4 Chemicals and Materials, BY Setting (USD Million)
  71.     4.4.1 Homecare
  72.     4.4.2 In-Patient
  73.     4.4.3 Out-Patient
  74.   4.5 Chemicals and Materials, BY End User (USD Million)
  75.     4.5.1 Hospitals & Clinics
  76.     4.5.2 Specialty Centers
  77.     4.5.3 Rehabilitation Centers
  78.     4.5.4 Others
  79. 5 SECTION V: COMPETITIVE ANALYSIS
  80.   5.1 Competitive Landscape
  81.     5.1.1 Overview
  82.     5.1.2 Competitive Analysis
  83.     5.1.3 Market share Analysis
  84.     5.1.4 Major Growth Strategy in the Chemicals and Materials
  85.     5.1.5 Competitive Benchmarking
  86.     5.1.6 Leading Players in Terms of Number of Developments in the Chemicals and Materials
  87.     5.1.7 Key developments and growth strategies
  88.       5.1.7.1 New Product Launch/Service Deployment
  89.       5.1.7.2 Merger & Acquisitions
  90.       5.1.7.3 Joint Ventures
  91.     5.1.8 Major Players Financial Matrix
  92.       5.1.8.1 Sales and Operating Income
  93.       5.1.8.2 Major Players R&D Expenditure. 2023
  94.   5.2 Company Profiles
  95.     5.2.1 Intuitive Surgical (US)
  96.       5.2.1.1 Financial Overview
  97.       5.2.1.2 Products Offered
  98.       5.2.1.3 Key Developments
  99.       5.2.1.4 SWOT Analysis
  100.       5.2.1.5 Key Strategies
  101.     5.2.2 Medtronic (US)
  102.       5.2.2.1 Financial Overview
  103.       5.2.2.2 Products Offered
  104.       5.2.2.3 Key Developments
  105.       5.2.2.4 SWOT Analysis
  106.       5.2.2.5 Key Strategies
  107.     5.2.3 Stryker (US)
  108.       5.2.3.1 Financial Overview
  109.       5.2.3.2 Products Offered
  110.       5.2.3.3 Key Developments
  111.       5.2.3.4 SWOT Analysis
  112.       5.2.3.5 Key Strategies
  113.     5.2.4 Zimmer Biomet (US)
  114.       5.2.4.1 Financial Overview
  115.       5.2.4.2 Products Offered
  116.       5.2.4.3 Key Developments
  117.       5.2.4.4 SWOT Analysis
  118.       5.2.4.5 Key Strategies
  119.     5.2.5 Johnson & Johnson (US)
  120.       5.2.5.1 Financial Overview
  121.       5.2.5.2 Products Offered
  122.       5.2.5.3 Key Developments
  123.       5.2.5.4 SWOT Analysis
  124.       5.2.5.5 Key Strategies
  125.     5.2.6 Siemens Healthineers (DE)
  126.       5.2.6.1 Financial Overview
  127.       5.2.6.2 Products Offered
  128.       5.2.6.3 Key Developments
  129.       5.2.6.4 SWOT Analysis
  130.       5.2.6.5 Key Strategies
  131.     5.2.7 Mazor Robotics (IL)
  132.       5.2.7.1 Financial Overview
  133.       5.2.7.2 Products Offered
  134.       5.2.7.3 Key Developments
  135.       5.2.7.4 SWOT Analysis
  136.       5.2.7.5 Key Strategies
  137.     5.2.8 Accuray (US)
  138.       5.2.8.1 Financial Overview
  139.       5.2.8.2 Products Offered
  140.       5.2.8.3 Key Developments
  141.       5.2.8.4 SWOT Analysis
  142.       5.2.8.5 Key Strategies
  143.     5.2.9 KUKA (DE)
  144.       5.2.9.1 Financial Overview
  145.       5.2.9.2 Products Offered
  146.       5.2.9.3 Key Developments
  147.       5.2.9.4 SWOT Analysis
  148.       5.2.9.5 Key Strategies
  149.   5.3 Appendix
  150.     5.3.1 References
  151.     5.3.2 Related Reports
  152. 6 LIST OF FIGURES
  153.   6.1 MARKET SYNOPSIS
  154.   6.2 SPAIN MARKET ANALYSIS BY TYPE
  155.   6.3 SPAIN MARKET ANALYSIS BY PRODUCT
  156.   6.4 SPAIN MARKET ANALYSIS BY APPLICATION
  157.   6.5 SPAIN MARKET ANALYSIS BY SETTING
  158.   6.6 SPAIN MARKET ANALYSIS BY END USER
  159.   6.7 KEY BUYING CRITERIA OF CHEMICALS AND MATERIALS
  160.   6.8 RESEARCH PROCESS OF MRFR
  161.   6.9 DRO ANALYSIS OF CHEMICALS AND MATERIALS
  162.   6.10 DRIVERS IMPACT ANALYSIS: CHEMICALS AND MATERIALS
  163.   6.11 RESTRAINTS IMPACT ANALYSIS: CHEMICALS AND MATERIALS
  164.   6.12 SUPPLY / VALUE CHAIN: CHEMICALS AND MATERIALS
  165.   6.13 CHEMICALS AND MATERIALS, BY TYPE, 2024 (% SHARE)
  166.   6.14 CHEMICALS AND MATERIALS, BY TYPE, 2024 TO 2035 (USD Million)
  167.   6.15 CHEMICALS AND MATERIALS, BY PRODUCT, 2024 (% SHARE)
  168.   6.16 CHEMICALS AND MATERIALS, BY PRODUCT, 2024 TO 2035 (USD Million)
  169.   6.17 CHEMICALS AND MATERIALS, BY APPLICATION, 2024 (% SHARE)
  170.   6.18 CHEMICALS AND MATERIALS, BY APPLICATION, 2024 TO 2035 (USD Million)
  171.   6.19 CHEMICALS AND MATERIALS, BY SETTING, 2024 (% SHARE)
  172.   6.20 CHEMICALS AND MATERIALS, BY SETTING, 2024 TO 2035 (USD Million)
  173.   6.21 CHEMICALS AND MATERIALS, BY END USER, 2024 (% SHARE)
  174.   6.22 CHEMICALS AND MATERIALS, BY END USER, 2024 TO 2035 (USD Million)
  175.   6.23 BENCHMARKING OF MAJOR COMPETITORS
  176. 7 LIST OF TABLES
  177.   7.1 LIST OF ASSUMPTIONS
  178.     7.1.1
  179.   7.2 Spain MARKET SIZE ESTIMATES; FORECAST
  180.     7.2.1 BY TYPE, 2025-2035 (USD Million)
  181.     7.2.2 BY PRODUCT, 2025-2035 (USD Million)
  182.     7.2.3 BY APPLICATION, 2025-2035 (USD Million)
  183.     7.2.4 BY SETTING, 2025-2035 (USD Million)
  184.     7.2.5 BY END USER, 2025-2035 (USD Million)
  185.   7.3 PRODUCT LAUNCH/PRODUCT DEVELOPMENT/APPROVAL
  186.     7.3.1
  187.   7.4 ACQUISITION/PARTNERSHIP
  188.     7.4.1

Spain Chemicals and Materials Market Segmentation

Chemicals and Materials By Type (USD Million, 2025-2035)

  • Equipment
  • Service
  • Consumables

Chemicals and Materials By Product (USD Million, 2025-2035)

  • Surgical Robots
  • Rehabilitation Robots
  • Noninvasive Radiosurgery Robots
  • Hospital and Pharmacy Robots
  • Emergency Response Robotic Systems
  • Logistics/Handling Robotic Systems
  • Imaging Robotic Systems

Chemicals and Materials By Application (USD Million, 2025-2035)

  • Neurology
  • Oncology
  • Orthopedic
  • Laparoscopy
  • Cardiology
  • Aesthetic surgery
  • Rehabilitation
  • Angiography
  • Others

Chemicals and Materials By Setting (USD Million, 2025-2035)

  • Homecare
  • In-Patient
  • Out-Patient

Chemicals and Materials By End User (USD Million, 2025-2035)

  • Hospitals & Clinics
  • Specialty Centers
  • Rehabilitation Centers
  • Others

Compare Licence

×
Features License Type
Single User Multiuser License Enterprise User
Price $4,950 $5,950 $7,250
Maximum User Access Limit 1 User Upto 10 Users Unrestricted Access Throughout the Organization
Free Customization
Direct Access to Analyst
Deliverable Format
Platform Access
Discount on Next Purchase 10% 15% 15%
Printable Versions