

Spain Industrial Automation & Equipment Market Segmentation
Industrial Automation & Equipment By Type (USD Million, 2025-2035)
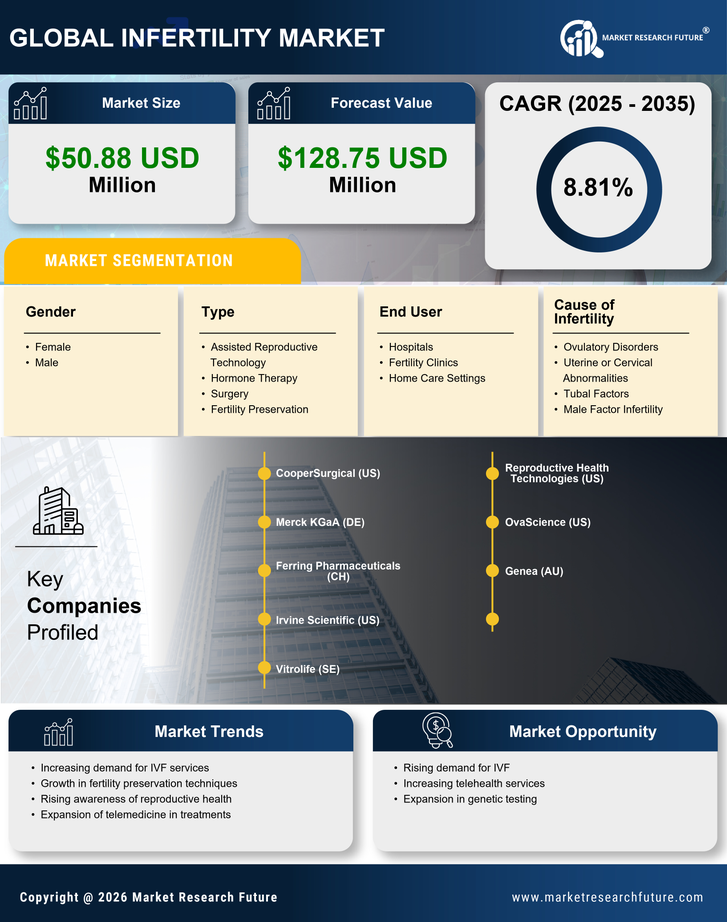
- Assisted Reproductive Technology
- Hormone Therapy
- Surgery
- Fertility Preservation
Industrial Automation & Equipment By End User (USD Million, 2025-2035)
- Hospitals
- Fertility Clinics
- Home Care Settings
Industrial Automation & Equipment By Gender (USD Million, 2025-2035)
- Female
- Male
Industrial Automation & Equipment By Cause of Infertility (USD Million, 2025-2035)
- Ovulatory Disorders
- Uterine or Cervical Abnormalities
- Tubal Factors
- Male Factor Infertility


