

Spain Chemicals and Materials Market Segmentation
Chemicals and Materials By Application (USD Million, 2025-2035)
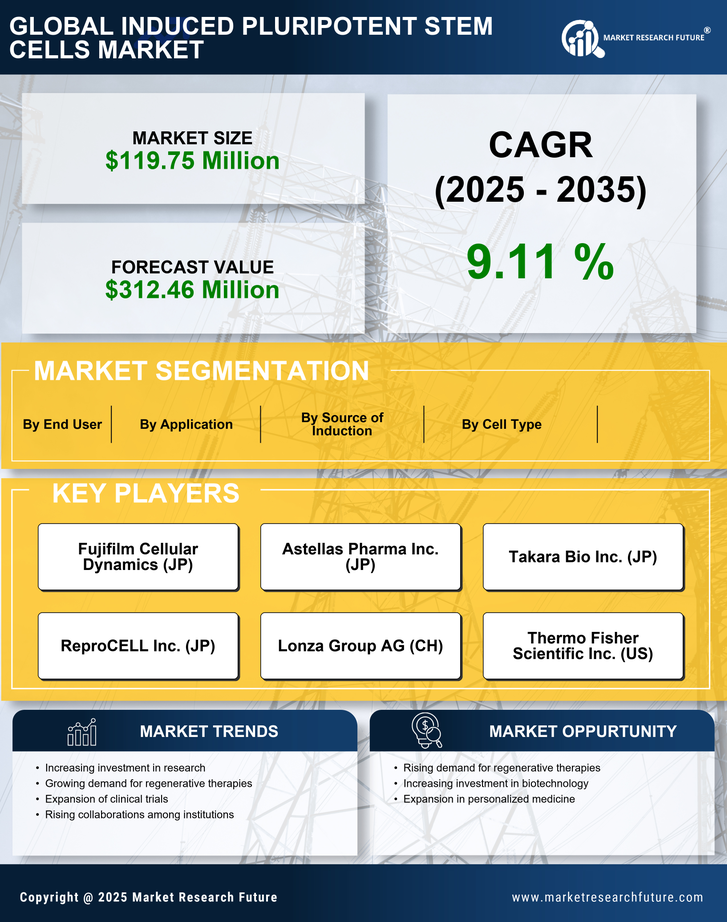
- Regenerative Medicine
- Drug Discovery
- Disease Modeling
- Toxicology Testing
- Gene Therapy
Chemicals and Materials By Cell Type (USD Million, 2025-2035)
- Cardiomyocytes
- Neurons
- Hepatocytes
- Pancreatic Cells
- Mesenchymal Stem Cells
Chemicals and Materials By Source of Induction (USD Million, 2025-2035)
- Transcription Factors
- Small Molecules
- MicroRNA
- Electroporation
- Viral Vectors
Chemicals and Materials By End User (USD Million, 2025-2035)
- Pharmaceutical Companies
- Research Institutes
- Biotechnology Companies
- Academic Institutions


